Krippendorff’s Alpha is a measurement of inter-rater reliability. The advantage of this approach is that it supports categorical, ordinal, interval, and ratio type data and also handles missing data.
Rating Table
Specifically, we assume that the ratings are organized in an n × m rating table, where the rows correspond to the subjects being rated, which we will label 1, …, n, and the columns correspond to the raters, which we will label 1, …, m. The rating used by all raters for all units takes the values 1, …, q, where the rating given by rater i to subject j is denoted cij. Missing data will be coded as cij = “”.
Since Krippendorf’s alpha is based on the computation of pairwise values, we need to eliminate any rows that contain no or only one non-missing value.
Note that for categorical ratings, the values 1, …, q represent names. For ordinal ratings, they represent ranks. For interval ratings, they represent interval scale data (e.g. decimals such as degrees Celsius). Finally, for ratio ratings, they represent ratio scale data (e.g. decimals such as degrees Kelvin).
Agreement Table
To make things clearer, we will use the rating table on the left side of Figure 1 as an example.
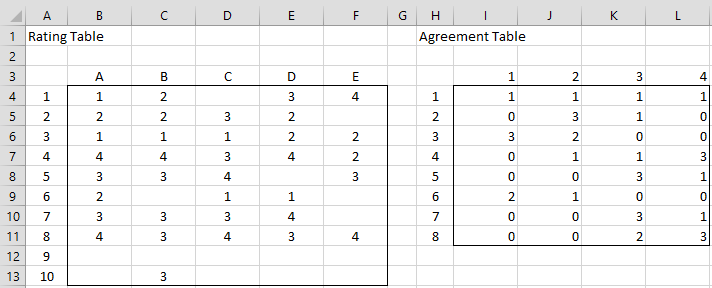
Figure 1 –Rating and Agreement Tables
In this example, there are 5 raters (A through E) who rate 10 subjects, using ratings 1, 2, 3, and 4. The first thing we need to do is transform the rating table into an agreement table, as shown on the right side of Figure 2.
The agreement table is an n × q matrix whose rows are the subjects from the rating table, where any row with fewer than two ratings is dropped. In the example in Figure 1, the last two rows are dropped: row 9 since it contains no ratings, and row 10 since it only contains one rating. The columns in the agreement table correspond to the rating categories 1, …, q.
For example, row 2 of the rating table shows that 3 raters give a 2 rating and 1 rater gives a 3 rating. This is reflected in row 2 of the agreement table. Note that this table can be constructed by placing the formula =COUNTIF($B4:$F4,I$3) in cell I4, highlighting the range I4:L11, and pressing Ctrl-R and Ctrl-D.
Krippendorff’s Alpha
As for Cohen’s kappa, we define Krippendorff’s alpha via the formula
![]()
We now show how to calculate pa and pe, but first, we need to define the weights that will be used.
Weights
Weights whk are defined on pairs of ratings, where 0 ≤ whk ≤ 1 and wkk = 1. These weights then define a q × q matrix. For our purposes, we will assume that this matrix is symmetric; i.e. wkh = whk.
We use weights that are based on whether the ratings use a categorical, ordinal, interval, or ratio scale. For any h, k with 1 ≤ h, k ≤ q, weight whk is defined as shown in Figure 2.
| categorical | 0 if k ≠ h and 1 if k = h |
| ordinal | |
| interval | |
| ratio | |
Figure 2 – Weights
Here 
Note too, that in Figure 2, a = the smallest rating value and b = the largest rating value. For the examples shown in this section, we will simply use ratings where
Examples
Example 1: Calculate Krippendorff’s alpha for the data in Figure 1 based on categorical weights.
As described above, we need to calculate the values of pa and pe. This is done using the following formulas
![]()
![]()
![]()
![]()
![]()
We now show how to calculate each of these formulas in Excel for Example 1 (see Figure 3).
Range O15:R18 contains the weights matrix. For categorical data, per Figure 2, this is the identity matrix, where there are ones in the main diagonal and zeros everywhere else. This can be calculated in Excel by putting the formula =IF(O$14=$N15,1,0) in cell O15, highlighting the range O15:R18, and then pressing Ctrl-R and Ctrl-D. Alternatively, the Real Statistics array formula =IDENTITY() can be placed in range O15:R18.
The rik* values are calculated via the array formula =MMULT(I4:L11,O15:R18) placed in range O4:R11. With categorical weights, the rik* values are identical to the rik in range I4:L11. The ri values are the sums of the rik values for each row. These can be calculated by placing the formula =SUM(I4:L4) in cell T4, highlighting the range T4:T11, and pressing Ctrl-D.
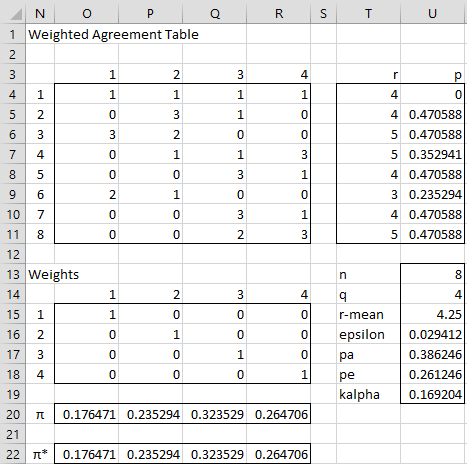
Figure 3 – Krippendorff’s Alpha
Figure 4 displays some representative formulas.
| Cell | Entity | Formula |
| T4 | r1 | =SUM(I4:L4) |
| U4 | p1 | =SUMPRODUCT(I4:L4,O4:R4-1)/($U$15*(T4-1)) |
| U13 | n | =COUNT(H4:H11) |
| U14 | q | =COUNT(I3:L3) |
| U15 | r-bar | =AVERAGE(T4:T11) |
| U16 | ε | =1/(U13*U15) |
| O20 | π1 | =SUM(I4:I11)*$U$16 |
| U17 | pa | =AVERAGE(U4:U11)*(1-U16)+U16 |
| U18 | pe | =SUMPRODUCT(MMULT(TRANSPOSE(O20:R20),O20:R20),O15:R18) |
| U19 | α | =(U17-U18)/(1-U18) |
Figure 4 – Representative formulas
Note that the formula for pe is an array formula. Note too that the πk* in range O22:R22 are calculated by the array formula =MMULT(O20:R20,O15:R18), as explained in Standard Error for Krippendorff’s Alpha.
Worksheet Functions
Real Statistics Function: The Real Statistics Resource Pack contains the following function:
KALPHA(R1, weights, ratings) = Krippendorff’s alpha for the n × q agreement table in R1 based on the weights and ratings in the second and third arguments.
weights is a q × q array or range containing the weights or the value 0 (default) if categorical weights are used, 1 if ordinal weights are used, 2 for interval weights, and 3 for ratio weights.
ratings is a q × 1 or 1 × q range containing the rating values. If omitted, then the ratings 1, …, q are used.
The Real Statistics Resource Pack also contains the following array function.
KTRANS(R1): returns the agreement table corresponding to the rating table in range R1.
KTRANS(R1, col): returns the agreement table that corresponds to the rating table in range R1, where column col is removed.
For Example 1, =KALPHA(I4:L11) takes the value .169204, which is the value found in cell U19. The array formula =KTRANS(B4:F13) returns the array in range I4:L11. The formula =KALPHA(KTRANS(B4:F13)) also outputs the Krippendorff alpha value of .169204.
Examples Workbook
Click here to download the Excel workbook with the examples described on this webpage.
Links
References
Gwet, K. L. (2015) On Krippendorff’s alpha coefficient
https://agreestat.com/papers/onkrippendorffalpha_rev10052015.pdf
Krippendorff, K. (2004) Reliability in content analysis: some common misconceptions and recommendations.
https://www.academia.edu/21851693/Reliability_in_Content_Analysis_Some_Common_Misconceptions_and_Recommendations
Girard, J. M. (2016) Krippendorff’s alpha coefficient, GitHub
https://github.com/jmgirard/mReliability/wiki/Krippendorff’s-alpha-coefficient
Dear Charles,
Thank you for your great explanation!
May I ask you about my research case? I have video data which is multi-labeled into 8 emotion classes. The data are rated by 2 raters. I want to examine the inter-rater agreement of the data annotation. Is Krippendorff’s Alpha suitable for my problem? If yes, do you know how to calculate Krippendorf’s Alpha in multilabel case? Thank you in advance. Have a good day!
Dear Tusty,
Is there a way to compare one set of the 8 emotion classes with another set of the 8 emotion classes?
Charles
Hello Dr. Charles Zaiontz.. Can you give explanation to me please about using krippendorff alpha on multi label data.
I very appreciate for your help..
Dear Abdul,
Is there a way to compare one set of the 8 emotion classeslabels with another?
Charles
Dear Dr. Charles Zaiontz,
thank you very much for your website, it has helped me a lot!
I’m calculating Gwet’s AC2, but I have problems with finding the weights assigned to ordinal data. I don’t understand the formula in Figure 2 (I do for the other measurement scales), nor the formula in the Gwet’s reference.
I tried different weighting tables, for 3 categories. When I use the GWET_AC2 command, with code 1 for ordinal data, Gwet’s AC2 is very much higher than when using weighting tables assigning values 0,5 (linear weights), 0,33, or 0,25 (quadratic weights) to adjacent categories (and 1 for the same categories, 0 for most disagreeing). Could you perhaps help me with the weights for cells (1,2), (2,3) in a 3 x 3 weight matrix?
Hello Leontien,
I can explain the formula in Figure 2 for ordinal data if you like, but from the rest of your comment it seems that your real issue is to decide what weights to use. What weights to use really depends on what sort of weights you believe are appropriate “in the real world”.
Let’s put the statistic analysis aside for a moment. What sort of weights do you believe are appropriate and why? If these don’t produce the results that you expect, then let’s discuss this further.
Charles
Dear Charles,
thank you for your response. I would think that one could argue for linear weights (0, 0,5 , 1) or quadratic weights (0, 0,25, 1) or something in between (0, 0,33, 1). To me it seems that 0,5 (in a 3×3 table, for one category difference) is a bit too lenient and 0,33 or 0,25 are more appropriate. (I’m looking at the interrater agreement of risk classification (low, medium, high risk for child abuse. In this case, one might also argue for different weights for e.g. low and medium vs medium and high.)
However, I also want to compare my findings with those of others, for another risk assessment instrument with similar ordinal categories, where also Gwet’s AC2 was being calculated. I don’t know which weights they have used, I assumed that they used code 1 for ordinal data and was surprised to see such a big difference in my own data with the results using the weighting tables that I constructed. The results that I found seem reasonable.
Krippendorf’s alpha’s are much lower , due to some categories occuring not often, in combination with disagreement about these occurences. I find it an interesting discussion whether Krippendorf’s alpha is or is not to harsh here and whether the Gwet’s AC2’s is or isn’t a better measure. I would like to report both measures, and compare both measures between the instruments.
Thank you,
Leontien
Hello Charles,
Thank you for a very informative page!
We want to calculate interrater reliability for a 7 point scale but we´re struggling with what approach we should use. The data is ordinal. We have 9 raters rating 17 different cases that each represent a level on the scale. We would like to examine interrater reliability for the whole scale as well as for the different levels. We want the results to adress “degree of agreeing/disagreeing” and not only if they rate the same or not.
Is Krippendorff´s alpha the right approach for us?
Jody,
I am not sure what you mean by the cases “represent a level on the scale”.
Probably Krippendorff’s Alpha or Gwet’s AC2 are the best choices, but I can’t say for sure.
Charles
Hey Charles,
First of all a big thanks. The tutorial is practical and seemingly a stand-alone excel based approach.
As an add-on for you and potential readers, here is the STATA based approach: https://journals.sagepub.com/doi/pdf/10.1177/1536867X1801800408
I gladly received the same results (with kappaetc command) but felt that the excel calculation helped me to grasp Krippendorff’s Alpha more in-depth.
Two questions/remarks:
1. You call it the weighted agreement table, but it seems it is just the copied agreement table which is then used for the weighted agreement calculation, right? One might consider renaming as I first thought this would be the final weighted values.
2. In Excel: beyond categorical weights, with which excel formulas would you calculate them?
Thanks and best,
Niklas
Hi Niklas,
Thanks for sharing the STATA link.
1. The entries in what I called the weighted agreement table consist of the entries in the agreement table to which the weights have been applied.
2. The formulas are given in Figure 2. The Excel versions are fairly similar. You need to use the function COMBIN for C(x,y) and RANK or RANK.AVG for the entries with a bar over them.
Charles
Good morning Charles,
Thank you for putting together such a brilliant resources. I’ve only just found it and it’s been very useful to clarify some concepts for me.
I’m currently carrying out a systematic review and I would like to look at the inter-rater concensus and the inter-rater agreements between some examiners. My team has used a risk of bias tool to assess a number of scientific studies and these have been rates as low risk of bias, moderate, serious and critical. I have given these values 1 = low to 4 = critical as these are catagorical variables with critical being the worst outcome for a paper.
When trying to calcute the agreement should I use Krippendorf or the AC1 calculation for the inter-rater consensus? Also could I use real stats to calculate the Kohen’s kappa for the inter-rater reliability?
Thank you for your help with this, it is much appreciated.
Kind regards,
Kenny
Hello Kenny,
Real Statistics can be used to calculate Krippendorf’s, Gwet’s AC1/AC2, or Cohen’s kappa (plus a few more). Generally, I prefer Gwet’s estimate.
Charles
thank you for the reply
Hi there,
I am doing content analysis on a curriculum and a language policy and the protocol allows for multiple coding. That is, more than one code can be applied to a unit of analysis. There are two coders and sometimes each coder applied different number of codes to the same unit (one may apply 3, the other 2). I am not sure whether K alpha would be suitable for this kind of data? It does not seem to work with the matrix. Do you think this type of data is more suited to a qualitative approach to agreement checking? Any thoughts appreciated
Hi Shawna,
If I understand correctly, each rater can attribute one or more rating codes to each subject. I don’t believe that Krippendorff’s Alpha can be used in this case.
Charles
Hi Charles,
Our research team wants to do Krippendorff Alpha analysis but we have a couple of questions for you if you can answer. Let me first described our data. Our data are CT-integrated subject area lessons. We aim to analyze it through the idea of integration so we came up with a rubric in which we have many components such as integration type, CT coherence, integration coherence, role of technology, and more. For each component, we have four categories: poor, fair, good, and excellent. We are using p symbol for poor, f symbol for fair, g symbol for good, and e symbol for excellent. After reading the method paper written by Krippendorff (2011), I thought that our data is “B. Nominal data, two observers, no missing data”. This is the second data type in that article. We thought that our data are nominal because we have four categories for each component in our rubric. We are two analyzers (raters) and we have no missing data. When the two raters agreed on the same category such as good (g), we say this is a yes because there is agreement. If we disagree, we say this is a no. However, “no missing data” part confused us because we do not analyze some components in the rubric for some lessons. I mean some components are not applicable (N/A) for some lessons such as that some lessons do not have a technology used (“role of technology” component). Could you please answer the following questions: Are our data nominal? Do we have “missing data” or “non-missing data” when we use not applicable for some components of the rubric?
Thank you so much for your answer in advance,
Emrah
Hello Emrah,
If you have 4 categories and there is no order to these categories, then the data is nominal.
If neither rater rates a particular component, then for your purposes this component doesn’t exist and so you don’t have any missing data.
Charles
Thank you so much for your response, Charles. Yes, it makes sense that we do not have any missing data. However, is it OK that we could have different number of components rated for different lessons. By this I mean that while we could have 10 components for a lesson that the two raters rated, we could have 13 components for another lesson that we both rated. In this case, can Excel calculate this correctly?
Another question I have if you don’t mind is that you said “If you have 4 categories and there is no order to these categories, then the data is nominal.” in your comment. What do you mean by order? Is having poor, fair, good, excellent considered an order?
Emrah
Hello Emrah,
1. If you are calculating separate measurements for each lesson, then it doesn’t matter whether the number of components is the same.
2. Yes, poor, fair, good, excellent are ordered, namely poor < fair < good < excellent. Charles
Is there a minimum recommended number of observations needed in order to test Krippendorf’s alpha?
I’m working with a team of 3 raters who are each providing expert evaluations (ratings) of each step associated with a task. One task may contain 3 steps (so, each rater provides 3 ratings) whereas on a different task, the task may contain 7 steps (so, each rater provides 7 ratings). They are providing ratings on a 1-3 scale.
We just ran our first session and it seemed like the more steps we have in a task, the easier it is to achieve a Kripp IRR standard of 0.667 and above.
For example: One team evaluated a task that had 3 steps and this was their output (first scores are always the first step, second scores are always second step, etc):
Rater 1: 1, 1, 1
Rater 2: 2, 1, 1
Rater 3: 1, 1, 1
Looks pretty good, but our Kripp IRR came back at….0.
I’m going to try your Excel formula now to see if I can replicate this, but….any insight as to why this may have happened (and implications for use)?
Hi Jade,
Krippendorf’s alpha is not a test, but a measurement, and so there is no minimum sample size. You could decide that you want the confidence interval for this measurement to be of a certain maximum size, though. In this case, you can calculate the minimum sample size required to achieve this. This approach is described for Cronbach’s alpha in Example 2 on the following webpage:
https://www.real-statistics.com/reliability/internal-consistency-reliability/cronbachs-alpha/cronbachs-alpha-continued/
With samples where all the ratings are almost equal, sometimes the various IRRs yield strange, counter-intuitive results. I believe that Gwet’s AC2 might yield better (i.e. more intuitive) results. You might consider trying Gwet’s AC2 to see whether things are better.
Charles
Hello,
Would this be appropriate for my study in which 20 raters are assessing 28 categories with 26 videos. Sometimes only 19 or 18 or 16 of my raters have assessed the video – I am trying to find a statistical test in which I can vary the value of m for each video analysis.
Does this make sense?
Thank you!
Arielle
Hello,
I understand that you have 26 videos (subjects) to rate. Each is rated by up to 20 raters. Each rating is one of 28 categories.
Yes, you can use Krippendorff’s Alpha to accomplish this. You can also use Gwet’s AC2.
Charles
Hello,
Thank you very much for your quick reply.
Each rating can be multiple of the 28 categories in my survey. So, a rater can select several categories to apply to one video (subject). The categories are clinical signs observed while watching the video and so raters have selected multiple clinicial signs (categories) per video.
Would Krippendorff’s Alpha/Gwet’s AC2 still work?
Thank you,
Arielle
Arielle,
I don’t know how to measure agreement in this case. I know how to measure agreement when (1) there are multiple videos and each rating consists of one category or (2) there is only one video and each rating can consist of multiple categories. I don’t know how to measure agreement when there are multiple videos and each rating consists of multiple categories.
Charles
Hello,
Thank you, that is helpful. If I may ask one further question, please – how would you measure agreement with one video and each rating consisting of multiple categories?
Kind regards,
Arielle
Hello Arielle,
You can think of each category as a subject. The ratings therefore for each category are Yes (that rater selects that category for the one video) or No (that rater doesn’t select that category). Now you can use Krippendorff’s (or Fleiss’ or Gwet’s) treating the categories as subjects and the new rating categories as Yes or No.
This assumes that the categories (i.e. subjects) are independent.
Charles
Hi there:) Thank you for the useful info.
My data set consists of 10 people rating 8 questions, rated on 4 point Likert scale (1-4).
Shall I use Krippendorff’s Alpha or fleiss kappa ?
And may I send you my data for calculation?
Thank you so much!
Hi Sharon,
Fleiss kappa only supports categorical data and not Likert data. THus you should use Krippendorff.
Sorry, you will need to do the calculations yourself.
Charles
Hello, could this be used to determine interrater reliability of participants using survey data? I am looking for a simple way to determine if people in a team shared the same opinions.
Yes, it could be used in this way.
Charles
Hello Sir, good day!
Thank you very much for writing about this test. I have a question about a scenario, where there are 2 raters. Both raters must choose 1 disease among 10 possible diseases for each patient. They will rate 25 different patients. Can I use Kripendorff’s alpha for this scenario, Sir?
Thank you very much,
Lunardi
Lunardi,
Krippendorff’s Alpha can be used for this scenario. You have two raters, 25 subjects and 10 categorical rating categories.
Charles
Thank you very much Sir,
Lunardi
Hi Charles,
Do you maybe know if I can convert Krippendorff’s alpha to ICC (or other inter-rater statistic), when I do know the Krippendorff’s alpha value (and also sample size, number of judges) but I don’t have the raw dataset (e.g., when doing a meta-analysis).
Thanks in advance
Antonis,
Sorry, but I don-t know how to make such conversion or even if it is possible.
Charles
Hello Dr. Zaiontz,
Thank you so much for the detailed examples and wonderful resources!
I have a dataset where 7 raters provide scores ranging from 1-4 for 20 students. I tried following the instructions and computed both K’s alpha and Gwet’s AC2. However, there seems to be quite a disparity in both values (i.e. 0.32 for K’s alpha, and 0.69 for Gwet’s AC2). Just wondering if such a big difference in reliability scores is normal? Because the data contained no missing values, I ran it the same way for both statistics (that is, by using the rating table, agreement table, and interval-level weights).
I don’t know whether this is normal. I would need to see the data in order to answer your question in the context of your data.
Charles
No problem; would it be possible to send you a copy of my data, in that case?
Many thanks,
Terri
Terri,
Yes, please send an Excel file.
Charles
Can we use krippendorffs alpha for computing inter rater reliability of multiclass multi label problem?
I not so familiar with the multiclass multi-label problem. Perhaps the following webpages would be useful
https://stackoverflow.com/questions/57256287/calculate-kappa-score-for-multi-label-image-classifcation
https://deepsense.ai/multilevel-classification-cohen-kappa-and-krippendorff-alpha/
Charles
Hello Charles,
I am trying to prepare the coder data to determine the Krippendorff alpha inter-coder reliability, but I am running into some issues on how to set up the data. Please help.
I have a priori codebook developed to analyze drawings. The codebook has TWO main CONSTRUCTS. Each of the CONSTRUCTS is divided into four SUB-Constructs each. Each sub-construct is coded to identify mutually exclusive instances either POSITIVE (+1) or NEGATIVE(-1) instance for each subconstruct.
This set-up gives 16 possible codes for each drawing, but because each pair is mutually exclusive the matrix will have eight empty cells and eight filled cells with a 1 or -1.
Before running the add on I have a question on how to prepare the coders’ results:
Do you recommend creating a matrix 16 x number of coders with the CUMULATIVE SUM of all the drawings for each sub-construct (16) as rows and coders in the columns?
OR should I create a matrix for each drawing with the results of the RAW code from data of either 1 and -1? So if I have 100 drawings should I create a matrix for each?
OR what is your recommendation for going about this issue?
Jo,
Sorry, but I don’t understand the scenario that you are describing.
Charles
Very useful article. Thank you for the detailed explanations.
I believe, though, that there is something missing in the Pa calculation, since the weights do not seem to be taken into account (this happens as well in Gwet’s AC2 calculation). If the weights are different from the identity matrix, the result is different from what I get with other tools (IrrCAC package in R, for example).
Hello Fiz,
Are you saying that (1) the weights are not taken into account (i.e you get the same result no matter what values are chosen for the weights) or (2) that the weights are taken into account but the wrong answer is generated?
Charles
Hello Charles,
thank you for your answer. My mistake, I thought that the range O15:R18 was not being taken into account for the Pa calculation, but then I noticed that the “Weighted agreement table” was taking it into account (hence the name). I was recreating your formulas from scratch and I missed that part. Nevermind and thank you for such amount of useful and very well explained resources.
Hello Charles,
thank you so much for all your helpful articles.
One question that I still have, however, is how to use the interrater reliability value once it’s calculated.
My scenario is as follows:
10 judges rate a number of images on a scale of 1* to 3*, were 1* is irrelevant and 3* is highly relevant.
Since I will need to continue doing calculations with that rating, I need to somehow aggregate the ratings of the judges.
So let’s do an example:
In an easy case, all 10 judges might say that this image is a 3*, then obviously the rating for that image should be a 3*.
But what happens, if 8 judges say it is a 3* and 2 judges claim it is only a 1*. Based on the interrater reliability, those two judges are very far away from the majority and probably not very reliable. How can I use that knowledge to find a reliable rating for this image? Because simply taking the average will result in the score being 2.5 and I think that is not 100% accurate.
I am actually not even sure if Kappa or any of the other methods to calculate interrater reliability are useful in this scenario. But maybe you could point me into the right direction. That would be greatly appreciated.
Thank you very much.
Hi Luisa,
I suggest that you use Krippendorff’s Alpha or Gwet’s AC2. These two measurements are designed for what you are speaking about.
Charles
Hi again,
How could Krippendorff’s Alpha be used to calculate the reliability of domain/subtest raw scores, or is there a more appropriate method?
For example, I have a test that includes 4 different domains/subtests, and each subtest consists of 10 Likert questions (1 through 4). Could the sums of all questions within a domain/subtest be used to calculate the reliability of the domain/subtest?
Additionally, could the total scores of all questions be used to calculate overall reliability of assessment?
Hello Matt,
Krippendorff’s Alpha can be used to measure agreement between raters. There are a number of types of reliability. If this is not the type of reliability that you are trying to measure, then Krippendorff’s is not the right tool. For example, if you are looking to measure the internal consistency type of reliability of a questionnaire then perhaps Cronbach’s alpha is the rights tool. All of these types of reliability are described on the Real Statistics website.
Charles
Thank you.
I guess I could ask my question another way. If there was a test of overall wine quality that included 10 questions that sum to a single score, would it be appropriate to use Krippendorff’s alpha to evaluate the inter-rater reliability of the total score? As a follow-up question, would Krippendorff’s alpha be appropriate to use for test-retest reliability of the same scorer to be able to ascertain stability of the assessment over time?
Dear Charles,
Thank you for the information. I find it very useful.
Does it make sense to calculate Krippendorff’s alpha for a test with one subject only? I have a project that is divided into several parts (since the options are different), one of which only has one subject. The raters are asked to choose between option A and B.
5 of them choose A and 1 chooses B.
alpha = -0.139
Is this correct? How should I explain this?
Hello Wei,
If there is only one subject, then what do you mean that 5 of them chose A and 1 chose B? I thought there was only one subject.
Since Krippendorff’s alpha is measuring agreement between the raters, there needs to be more than one rater; otherwise you can’t measure agreement.
Charles
Thanks, and sorry for not making myself clear.
What I meant was that there were 5 raters (A,B,C,D,E) giving ratings (1,2) on one subject. Raters A, B, C and D give rating ‘1’, and E gives rating ‘2’.
Hello Wei,
Thanks for the clarification. I misunderstood your previous comment. Sorry about that.
In any case, you need more than one subject to calculate Krippendorff’s alpha.
Charles
Which measurement of inter-rater reliability can I use when there is just one subject, multiple raters (>5) and an ordinal rating scale from one to three?
You need more than one subject for all the measures that I am familiar with.
Charles
Hello Dr. Zaiontz,
Thank you for providing the software and detailed directions. I am trying to calculate Krippendorf’s alpha for an experiment I conducted, and I keep calculating negative values for the ‘p’ column. Is this normal?
Hello Sarah,
If I remember correctly, the p column contains probabilities and so shouldn’t contain any negative values.
If you send me an Excel file with your data and calculations, I will try to figure out what is going wrong.
Charles
Hi!
I had my developed tool validated by 5 experts (3 nurse experts and 2 psychology majors). The tool has 39 items/statements with 4 categories (not relevant, slightly relevant, quite relevant, highly relevant). Can I use the Krippendorff alpha to test the inter-rater reliability or the Fleiss kappa?
Thanks
Hi Rica,
Since the ratings are ordinal (i.e. ordered), you shouldn’t use Fleiss’ kappa. You can use Krippendorff’s alpha or Gwet’s AC2.
Charles
Hello Charles, thank you for the reply.
I can understand and follow through the kalpha in excel, except about the weights in figure 3 (O15:R18)..
Rica,
You don’t have to assign the weights. Instead you can use the default weights for ordinal data.
Charles
Hello Charles,
What if I use only 2 ratings (not relevant & relevant) instead of 4 (not relevant, slightly relevant, quite relevant, highly relevant)? Can I use Fleiss kappa?
Hello Rica,
Yes, since two rating can be considered to be two categorical ratings, which Fleiss Kappa handles.
Charles
This is very helpful, I am confused about the weights table. Should the above read “default weights for CATEGORICAL data”?
I am struggling to calculate the weights in excel.
I have ordinal data (ie categories 1a;1b;2a;2b etc up to a total of 8 categories)
Many thanks
Hello Mike,
The default weights depend on the type of data (categorical, ordinal, etc.). You can override these by using your own weights table.
Is the order of your categories 1a < 1b < 2a < 2b < 3a < 3b < 4a < 4b ? Do you want these to be treated as a Likert scale (e.g. 1 < 2 < 3 < 4 < 5 < 6 < 7 < 8 ? Charles
When using Krippendorff’s Alpha with Likert scale data, does range restriction need to be considered? If so, I am wondering how to do it?
And thanks for the great software.
Hello Matt,
What sort of range restriction do you have in mind?
Charles
I have Likert data that has a natural ceiling and floor based on the number of questions and range of the scale (e.g., 10 questions, Likert between 1 – 4, range between 10 and 40).
Actually, I guess I can answer my own question by looking at mean, SD, skewness, and kurtosis. Unless the data is squeezed to either extremes, I think limited range would not be an issue.
What are the significant ranges of Kalpha?
Hello Jessica,
Are you asking me about a confidence interval for kalpha?
Charles
I would like to ask if it’s normal to have a -.0111! I’m sure something is wrong with the way I ran the test! I have 20 questions and are nominal, each variable with 111 students. Is it because of the large number?
I don’t think the result is questionable simply because you have such a large number. Actually it isn’t really such a large number.
If you send me an Excel file with your analysis, I can look at it and give you feedback.
Charles
Sir Good pm I am having a hard time installing this add on. Thank you.
What sort of problems are you having?
Charles
Hi Charles,
can you explain more about the pi* values in the cells o22:r22? I don’t see any explanations about this. Thanks.
Hi Hong,
Yes, you are correct. Range O22:R22 are calculated by the array formula =MMULT(O20:R20,O15:R18). I have now explained this better on the webpage. Thank you for identifying this omission.
Charles
Dr. Zaiontz,
Is Krippendorff’s alpha primarily used in sociological contexts as a
qualitative content analysis tool? Can it be used in a clinical context with quantitative data?
Thank you,
Winford
Hello Winford,
I don’t know where Krippendorff’s alpha is typically used. It certainly can be used in a clinical context with quantitative data.
Charles
Can statistical significance (p-value) be determined for Krippendorff’s alpha?
Dennis,
I don’t know of any way to calculate a p-value. In any case, what hypothesis would you want to test? That alpha is significantly different from zero?
Charles
Hi, could you help me to check if my formulas in cell O15 for other data types are correct?
ordinal: =IF(O$14=$N15,1,1-(COMBIN(ABS(O$14-$N15)+1,2)/COMBIN($U$14,2)))
interval: =1-POWER((O$14-$N15)/(MAX($O$14:$R$14)-MIN($O$14:$R$14)),2)
ratio: =1-POWER((O$14-$N15)/(O$14+$N15),2)
The k-alpha I’ve got are:
ordinal: 0.4827852 (I doubt this result)
interval: 0.542026709
ratio: 0.521144788
Thank you.
Tai,
I am sorry, but I don’t have time to check your formulas. The formulas should be based on the formulas in Figure 2. You can check your work by using Real Statistics’ Interrater Reliability data analysis tool and choosing one of the two K alpha options.
Charles
Hi,
I’ve tried the tools, the formulas and results are correct.
Thank you.
Tan,
Good to hear.
Charles
Hi,
thanks for these information. However, using Excel 2016 and even if I corrected syntax in formula, Still I can’t compute Pe.The error message point to the “TRANSPOSE” command. Can you help?
Thank you
Diane,
If you email me an Excel file with your data and analysis, I will try to figure out why you are getting this error message.
Charles
Hi, TRANSPOSE function is not supported inside MMULT.
You can workaround by creating a separated transposed matrix of 020:R20.
Tan,
The TRANSPOSE function can be used inside MMULT, provided you press Ctrl-Shft-Enter.
Charles
how to find pe value in u18 cell?
See Figure 4 for the answer.
Charles
Dear Charles,
Thank you so much for your website, it is incredibly helpful. I am trying to calculate Krippendorff alpha on a data set where there are 8 subjects, 3 categories (0, 1, 2) and 44 raters. The part I am confused about is how to calculate the weighted table for such a data set. In the example, you use a symmetrical data set but I wonder if mine would be asymmetrical?
I would appreciate your input on this.
Adam,
You can use asymmetric weights, but currently I have only implemented symmetric weights.
Charles
Could you please specify the function C in Figure 2?
Dag,
C(n,m) is the combination function, which is implemented in Excel by COMBIN.
Charles