Basic Concepts
To calculate Kendall’s coefficient of concordance W, each judge rates all the subjects. In this measure of agreement, judges choose between a pair of subjects instead. Kendall’s coefficient of agreement u is then a measure of agreement among the judges regarding all the subjects.
Note that it is possible that a judge rates subject A over B, B over C, and then C over A. We, therefore, see that pairwise preference is not transitive.
u is calculated based on a Preference Matrix. If there are n subjects and k raters, then the preference matrix is an n × n matrix P = [aij] where aij = the number of judges that prefer subject i over j. Note that each judge rates each pair exactly once.
Clearly, aij + aji = k for i ≠ j and aii = 0. If there is complete agreement between the judges, then C(n,2) entries in P will have the value k and the others will contain 0.
We define u to be
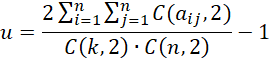
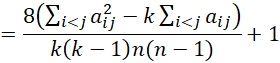
Note that you arrive at the same result if the summation where i < j is replaced by a summation where j < i.
We can use a chi-square statistic to determine whether the population parameter corresponding to u is significantly different from zero (indicating no agreement between the judges). The test is
χ2 = [u(k-1)+1]df ∼ χ2(df)
where df = C(n, 2) = n(n-1)/2.
Example
Example 1: Eight food critics are asked to rate the importance of 5 factors when choosing a restaurant based on paired comparisons. The factors are location, food, menu, service, and price. For each of the C(5,2) = 10 pairs of these factors, each critic gives 1 point to the factor they believe is more important, giving each ½ if they believe they are of equal importance. Determine whether there is significant agreement between the critics based on the total points for each pair as shown in range B2:G7 of Figure 1 (e.g. food won over location by 5 to 3 (see cells D3 and C4).
Figure 1 also displays the analysis, as explained next.
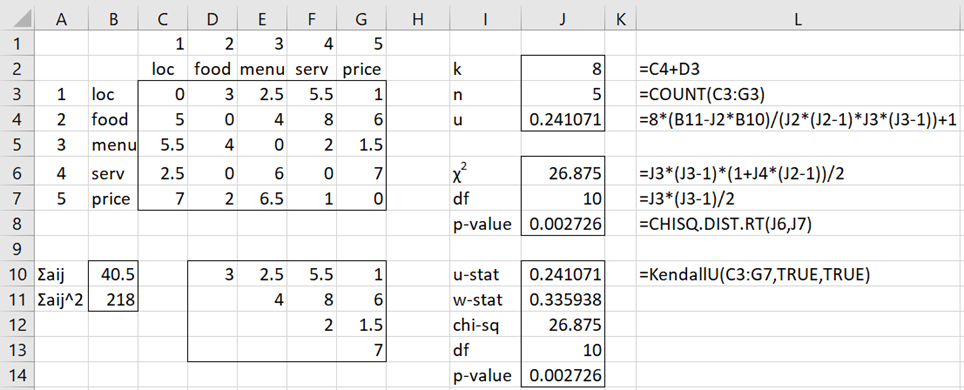
Figure 1 – Kendall’s u for paired comparisons
We start by inserting the formula =IF($A3<D$1,D3,””) in cell D10, highlighting range D10:G13, and pressing Ctrl-R and Ctrl-D. We then obtain ∑i<j aij = 40.5 (in cell B10) by inserting the formula =SUM(D10:G13) in cell B10. Similarly, we obtain ∑i<j aij2 = 218 (in cell B11) via the formula =SUMSQ(D10:G13).
The remaining calculations are shown in Figure 1. Since p-value = .002726 (cell J8), we conclude that there is significant agreement between the raters.
Worksheet Functions
Real Statistics Function: The Real Statistics Resource Pack provides the following function for R1 that contains a preference matrix (without headings).
KENDALLU(R1, lab, comp, alpha, lookup): returns a column array with u-stat, W-stat (see below), χ2-stat, df, and p-value for Kendall’s u test on the square preference matrix in R1 (without headings).
If lab = TRUE (default FALSE), an extra column of labels is appended to the output. alpha is the significance level (default .05). If comp = TRUE (default), then the data in R1 contains comparison ratings; otherwise, it contains ranking data (see Kendall’s u for Paired Ranks).
For Example 1, the formula =KendallU(C3:G7,TRUE) produces the output shown in range I10:J14 of Figure 1.
Table Lookup
When k ≤ 6 and n ≤ 8, then a table lookup is used instead of the chi-square approximation described above when the lookup argument is set to TRUE (default). In this case, the χ2-stat and df fields in the output from KENDALLU take the value N/A.
In addition, the Real Statistics Resource Pack provides the following worksheet function to generate the p-value for the test in these cases.
KENDALLU_PROB(k, n, u) = p-value for Kendall’s u test for paired comparisons when the number of raters is k and the number of subjects being rated is n for the specified value of u.
For example, =KENDALLU_PROB(5, 6, .227) takes the value .0108.
Examples Workbook
Click here to download the Excel workbook with the examples described on this webpage.
Links
Reference
Siegel, S., Castellan, N. J. (1988) Nonparametric statistics for the behavioral sciences, 2nd ed.
https://psycnet.apa.org/record/1988-97307-000