We now describe another approach to interrater reliability which avoids a number of situations where agreement is not adequately reflected by the measurement.
We will assume that rating data and weights are formatted as for Krippendorff’s alpha. As for Krippendorff’s alpha, Gwet’s AC2 can handle categorical, ordinal, interval, and ratio rating scales as well as missing data.
Gwet’s AC2 measure is also calculated by the formula
but the formulas for pa and pe are similar but different from those for Krippendorff’s alpha. Once again pa is based on pairwise values, but the value of pe is based on all subjects that are rated at least once.
We begin by defining the following where the rik are the entries in the Agreement Table and the whk are the weights in the Weights Table:
ri = the number of raters that assigned some rating to subject i.
n = the number of subjects that are rated by at least one rater; i.e for which ri ≥ 1
n* = the number of subjects that are rated by at least two raters; i.e for which ri ≥ 2
The formulas for pa and pe are now defined as follows:
![]()
![]()
![]()
![]()
Here, the pi are only defined when ri ≥ 2.
Example
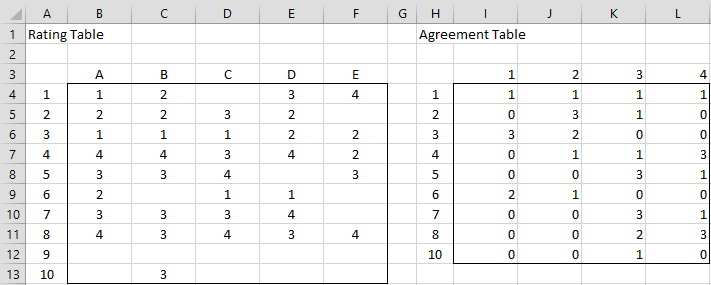
Example 1: Calculate Gwet’s AC2 for the data in Figure 1 of Krippendorff’s Alpha Basic Concepts (repeated in range A3:F13 of Figure 1 below), based on categorical rating weights.
Figure 1 – Rating and Agreement Tables
The agreement table can be calculated from the rating table, as for Krippendorff’s alpha, except that this time, we retain all non-blank rows from the rating table; i.e. only row 9 from the rating table is not captured in the agreement table.
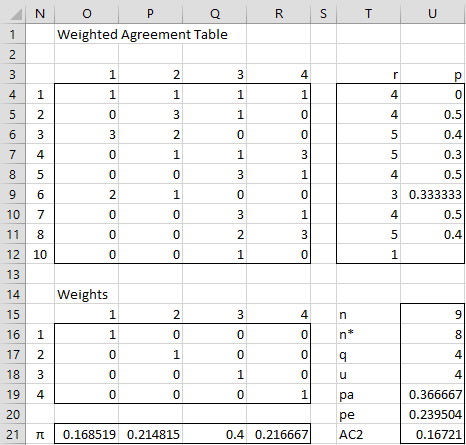
We now calculate Gwet’s AC2 in Excel as shown in Figure 2.
Figure 2 – Calculation of Gwet’s AC2
Key formulas are as shown in Figure 3.
| Cell | Entity | Formula |
| T4 | r1 | =SUM(I4:L4) |
| U4 | p1 | =IF(T4>=2,SUMPRODUCT(I4:L4,O4:R4-1)/(T4*(T4-1)),””) |
| U15 | n | =COUNT(H4:H12) |
| U16 | n* | =COUNTIF(T4:T12,”>=2″) |
| U17 | q | =COUNT(I3:L3) |
| U18 | u | =SUM(O16:R19) |
| U19 | pa | =AVERAGE(U4:U12) |
| O21 | π1 | =AVERAGE(I4:I12/$T4:$T12) |
| U20 | pe | =U18*SUMPRODUCT(O21:R21,1-O21:R21)/(U17*(U17-1)) |
| U21 | AC2 | =(U19-U20)/(1-U20) |
Note that the formulas for the πk are array formulas.
Worksheet Functions
Real Statistics Functions: The Real Statistics Resource Pack contains the following function:
GWET_AC2(R1, weights, ratings) = Gwet’s AC2 for the agreement table in range R1 based on the weights and ratings in the second and third arguments.
The weights argument is a q × q range containing the weights or the value 0 (default) if categorical weights are used, 1 if ordinal weights are used, 2 for interval weights and 3 for ratio weights.
The ratings argument is a q × 1 or 1 × q range containing the rating values. If omitted then the ratings 1, …, q are used.
The Real Statistics Resource Pack also contains the following array function where R1 is a range containing a rating table:
GTRANS(R1): returns the agreement table that corresponds to the rating table in range R1.
GTRANS(R1, col): returns the agreement table that corresponds to the rating table in range R1 where column col is removed.
For Example 1, =GWET_AC2(I4:L12) takes the value .16721, which is the same value as that found in cell U20. The array formula =GTRANS(B4:F13) returns the array in range I4:L12. The worksheet formula =GWET_AC2(GTRANS(B4:F13)) also outputs the AC2 value of .16721.
Examples Workbook
Click here to download the Excel workbook with the examples described on this webpage.
References
Gwet, K. L. (2001) Handbook of Interrater reliability. STATAXIS Publishing
Gwet, K. L. (2015) On Krippendorff’s alpha coefficient
https://agreestat.com/papers/onkrippendorffalpha_rev10052015.pdf


Hello Charles,
Thanks a lot for your page!
When I use your method to calculate Gwet AC2 using date on page 6 of Emily and Kevin, I find the result is different. Perhaps when the numbers of misclassification probabilities are not zero on the non-primary diagonal of a matrix, I can not use your method to calculate Gwet AC2? Or I misunderstand your method?
Looking forward to your reply. Thank you.
Reference
Blood, Emily, and Kevin F. Spratt. “Disagreement on agreement: two alternative agreement coefficients.” SAS Global Forum. Vol. 186. 2007.
Qingyu
Sorry, but I don’t have access to the paper you are referencing.
Charles
Hi Charles,
I have data with a non-disjoint categorical rating (thus, an agreement table, where the row sums can become > the number of raters). Can I still apply Gwet’s AC1?
… and thanks a lot for your page! It is very helpful!
Katharina
Hi Katharina,
Probably not. Is there any way to apportion the ratings (e.g. .5 and .5) so that the sum is one?
Charles
Hi Charles,
I tried that by dividing each vote by the number of categories the rater selected for the respective subject. While without doing this, the agreement calculated was very low (~2%), now I even get negative values (~-23%). I’m not sure how to interpret this in the context of uncertainty if it is applicable at all to this type of data. Our methodology includes that all raters at the end come to a consensus after discussing their individual votes, so I guess providing the inter rater reliability for the intermediate result is not that crucial and I will just skip that.
Nevertheless, I would be curious if someone has some recommendation, what is the appropriate measure in such a case.
Katharina
Hi Katharina,
Yes, these are indicators of lack of agreement. I am curious to see how consensus approach overcomes the lack of agreement.
Charles
Hi charles. Im having some trouble entering the data and installing the excel. For example how do i enter data for a questionnaire that has 25 questions, and there are more than 1 pair, e.g.
Pair a = rater 1 and rater 2
Pair b= rater 1 and rater 3
Etc…
You don’t need to create multiple paired Gwet’s AC2 measurements. You can create one AC2 measurement based on all 25 questions and all raters. The format to use is described on this webpage.
Charles
Thank you Charles for the reply. Manage to key in the data, do the AC value have their p-value? in the template, is the p-value calculated? Thanks
No, the p-value is not calculated, but a 1-alpha confidence interval is provided, which is arguably more useful.
Charles
Thanks Charles.
Where in the template can i get the 1-alpha confidence interval value?
Also, I am planning to publish my study results. How do i cite you in my article?
Hello Husna,
See the following regarding the confidence interval:
https://real-statistics.com/reliability/interrater-reliability/gwets-ac2/gwets-ac2-confidence-interval/
See the following regarding the citation:
https://real-statistics.com/appendix/citation-real-statistics-software-website/
Charles
Hi Charles,
Thanks so much for your site.
I have a data where two raters score 800 comments for the presence or absence of a variable (so, categorical), and the variables rarely occur (so, Gwet’s).
I’m having trouble following all the steps needed to make my data ready to analyze. My data currently looks like:
Comment Rater 1 Rater 2
1 1 0
2 0 0
3 1 1
and so on.
It sounds like I need to make a weights matrix, is that just going to be [1,0][0,1]? If there’s no missing data do I still need to make an agreement table? I started with Krip’s alpha basic concepts but I didn’t get super far. Thanks very much for your help in advance!
Hello Ben,
The table you have provided appears to be in the correct form of a Rating Table. You don’t need to create the Agreement Table. You also don’t need to create weights (unless you want to do so) and simply use the default for categorical ratings, namely 0.
E.g. in the dialog box shown in Figure 2 of https://real-statistics.com/reliability/gwets-ac2/gwets-ac2-analysis-tool/ choose the Gwet’s AC2 (rating table) option and put 0 in the Weights field.
Charles
hola Charles.
cual es la interpretaciobn que puedes darle al modelo de AC2
Hello David,
There isn’t clear-cut agreement on what constitutes good or poor levels of agreement, although a common, although not always so useful, set of criteria is: less than 0% no agreement, 0-20% poor, 20-40% fair, 40-60% moderate, 60-80% good, 80% or higher very good.
Charles
Hello Charles,
Thanks a lot for your page!
I had a problem with the analyze of my results with fleiss’ Kappa so i used Gwet AC2 (Because for one group of patients, all the raters are agreed , so I was expecting to see a perfect agreement, and Fleiss’ kappa of 1, but when i tried to use the “interrupter reliability” tool, no Kappa was calculated (says there is an error in the formula) or the Kappa was negative.)
Can we analyze the Gwet AC2 in the same way as Fleiss’ Kappa ? With Landis and Koch’s interpretation ?:
0.0-0.20 Slight agreement
0.21-0.40 Fair agreement
0.41-0.60 Moderate agreement
0.61-0.80 Substantial agreement
0.81-1.0 Almost perfect agreement
Leanne,
Probably so, but recall there is no universally agreed upon interpretation of Fleiss’ kappa, including Landis and Koch’s, either.
Charles