Worksheet Functions
In addition to the GWET_AC2 and GTRANS functions described in Gwet’s AC2 Basic Concepts, we now describe some other functions.
Real Statistics Functions: The Real Statistics Resource Pack contains the following array functions:
GWET_SES(R1, lab, weights, ratings, alpha, scorrection): returns a 4 × 1 column array with the following elements: Gwet’s AC2 for the data in the Agreement Table in range R1, the corresponding standard error for subjects and the lower and upper ends of the 1 – alpha confidence interval for Gwet’s AC2.
GWET(R1, lab, weights, ratings, alpha, scorrection, rcorrection): returns a 7 × 1 column array with the following elements: Gwet’s AC2 for the data in the Rating Table in range R1, the corresponding standard error for subjects and the lower and upper ends of the 1 – alpha confidence interval for Gwet’s AC2, followed by the total standard error, including subjects and raters) and the lower and upper ends of the 1 – alpha confidence interval corresponding to this standard error.
The weights and ratings arguments are as for GWET_AC2 (see Gwet’s AC2 Basic Concepts). alpha is the significance level (default .05). The subject and rater correction factors, scorrection and rcorrection, are the f parameters described previously.
If lab = TRUE, then an extra column with labels is appended to the output (default is FALSE).
In addition, the Real Statistics Resource Pack contains the following non-array function. This function requires that there are at least three raters.
GWET_SER(R1, lab, weights, ratings, alpha, rcorrection) = the standard error for raters, where range R1 contains data from a Rating Table.
Example
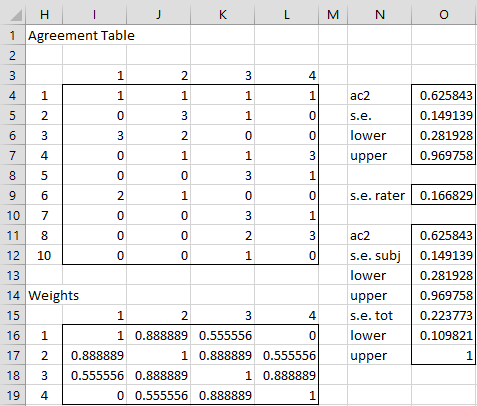
Example 1: Repeat Example 1 of Gwet’s AC2 Basic Concepts and Example 1 of Gwet’s AC2 Confidence Interval for interval ratings using the Real Statistics functions.
Figure 1 – Gwet’s AC2 for interval scale ratings
The formula =GWET_AC2(I4:L12) takes the value .6258, as shown in cell O11.
The array formula =GWET_SES(I4:L12,TRUE,2) produces the output shown in range N4:O7. The same result can be obtained from the formula
=GWET_SES(I4:L12,TRUE,I16:L19).
The formula =GWET_SER(B4:F13,2) produces the standard error for raters as shown in cell O9. The array formula =GWET(B4:F13,TRUE,2) produces the output shown in range N11:O17.
Data Analysis Tool
Real Statistics Data Analysis Tool: We can use Real Statistics’ Interrater Reliability data analysis tool to calculate Gwet’s AC2 and its confidence intervals.
For Example 1, press Ctrl-m and select the Interrater Reliability option from the Corr tab of the Multipage interface as shown in Figure 2 of Real Statistics Support for Cronbach’s Alpha. If using the original interface, then select the Reliability option from the main menu and then the Interrater Reliability option from the dialog box that appears as shown in Figure 3 of Real Statistics Support for Cronbach’s Alpha.
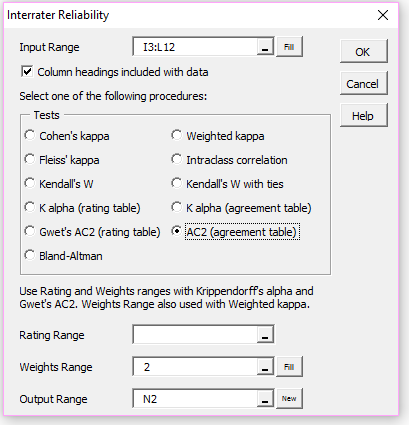
In either case, fill in the dialog that appears as shown in Figure 2 and click on the OK button.
Figure 2 – Interrater Reliability dialog box
The output is similar to that shown in range N4:O7 of Figure 1.
Examples Workbook
Click here to download the Excel workbook with the examples described on this webpage.
References
Gwet, K. L. (2001) Handbook of Interrater reliability. STATAXIS Publishing
Gwet, K. L. (2015) On Krippendorff’s alpha coefficient
https://agreestat.com/papers/onkrippendorffalpha_rev10052015.pdf


Hi Charles,
I’m running IRR on each question on an exam, with scores on 17 instances of the exam by pairs of raters, as Gwet’s AC2 with weight =1 for ordinal data. The scores range from 0-5. However, sometimes when I ran Gwet’s AC2 (or Krippendorf’s alpha) I got a blank output, all zero’s. I was wondering if maybe it’s because my scoring range includes zero, so I tried transposing all scores up by one, so my range is 1-6. I was then able to calculate Gwet’s AC2, but bizarrely, the scores are different for the datasets that I had already been able to score. Why would this be the case?
Exam # Scorer 1 Scorer 2
32022003 2 5
42022029 2 3
62022005 3 4
102022003 3 2
132022006 4 2
162022003 4 2
182022011 4 2
192022002 3 3
232022006 2 4
262022009 2 2
302022018 2 2
342022001 3 5
382022011 2 2
392022024 4 5
402022002 5 4
472022001 1 1
482022011 2 2
Gwet’s AC2 = 0.62728
———————
Exam # Scorer 1 Scorer 2
32022003 3 6
42022029 3 4
62022005 4 5
102022003 4 3
132022006 5 3
162022003 5 3
182022011 5 3
192022002 4 4
232022006 3 5
262022009 3 3
302022018 3 3
342022001 4 6
382022011 3 3
392022024 5 6
402022002 6 5
472022001 2 2
482022011 3 3
Gwet’s AC2 = 0.75832
Thanks,
Cathy
Hello Cathy,
1. Since scores used by Gwet’s AC2 or Krippendorf’s alpha are based on the rankings of your data (beginning with 1). Thus, 0, 1, 2, 3, 4, 5 does get mapped into the rankings 1, 2, 3, 4, 5, 6.
2. Regarding, your statement that “the scores are different for the datasets that I had already been able to score”, I would need to see how you scored the previous datasets.
Charles
Sorry I should have added that the data is nominal level.
Dear Charles – I wonder if you could be kind enough to help with what should be a simple reliability test
I need to run a Gwet reliability test on a single variable – all I need is the Gwet agreement coefficient. It has two coders (2 columns) and 83 values (83 rows) that have been classified by the two coders in an Excel spreadsheet.
I have downloaded and installed your statistical software but after three hours of trying to run the test I still haven’t managed to get the test to work properly. I imagine it should take a couple of minutes if I could work out what I was doing wrong.
Would you be so kind as to offer me a bit of step by step advice on how I actually run the test?
Thanks Mike
Hello Mike,
Have you formatted the data as described?
If you email me the Excel spreadsheet and any results you obtained, i will try to figure what the problem is.
Charles
Thanks Charles that’s very kind I will send it through. Best Mike
Hi
Thank you for providing these resources. I am having some issues getting the Real Statistics Data Analysis Tool to work for ratio data for both Gwet AC2 and Kalpha. The tools are working fine for the other measures that are ordinal and categorical. But the output is just 0s if I do the rating tables for Gwet and Kalpha. Any idea what the issue might be?
I created an agreement table and that did cause the tool to give me non 0 values, but when i compared the results of the kalpha one to other stats packages, it was giving me different results (whereas the other ways of measuring it were consistent). So that doesnt give me confidence in the Gwet output either (which unfortunately I have no other ways to calculate currently).
Would appreciate any help you can provide.
Thanks!
Joe
Hi Joe,
If you email me an Excel file with your data and results, I will try to figure out what is going wrong.
Charles
Hi Charles
thank you for the reply. I emailed the excel file a few days ago. Please let me know if there are any issues.
Kind regards
Yousaf
Hi Yousaf,
Sorry, but I don-t seem to have received an email from you in the past few days. Can you send it again?
Charle
Hi Charles
sure no problem I will send it today. I think i might have an idea of what is going wrong. I think the analysis tool is treating 0s as missing values, instead of 0 scores. but it’s just a hunch. the other types of data dont have 0 scores so i think the issue isnt arising.
Will send through the email now. thanks again!
Yousaf
Hi Yousaf,
I received your email. I will look at it shortly.
Charles
Hi Yousaf,
Thanks for sending me your data and analysis.
Yes, the problem is that you can’t use a zero rating. The lowest possible rating is 1. This is described in the second paragraph of
https://www.real-statistics.com/reliability/interrater-reliability/krippendorffs-alpha/krippendorffs-alpha-basic-concepts/
Charles
another possibility is that the analysis tool is trying to divide 0 scores by 0 and that is causing the issue. But either way i think the 0 scores are involved with the errors
Hi Charles
Thank you for the quick reply.
i’m assuming it is this paragraph “Since Krippendorf’s alpha is based on the computation of pairwise values, we need to eliminate any rows which contain no or only one non-missing value.”? I see, i guess my issue was I did not consider the 0s as missing values, but just the rating the person got.
Is there a suggested way around this? Would adding 1 to all scores work? (0s become 1s, 1s become 2s etc). Would the kalpha and gwet scores still be correct? Apologies if the solution is already there, i am struggling to work it out.
Thanks
Yousaf
Yousaf,
This is a good approach for rating using categorical, ordinal or interval weights. It is probably ok for ratio weights, but I am not 100% sure.
Charles