The values obtained for the mean and limits of agreement for Bland-Altman, as described in Bland-Altman Plot, are based on a single sample, and so may or may not reflect the values for the whole population. Thus, it is useful to look at confidence intervals for these values.
Formulas
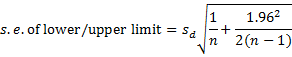
To calculate these confidence intervals, we first note that the standard errors for the mean and agreement limits are
![]()
Example
For Example 1 of Bland-Altman Plot, these standard errors are shown in range W6:W8 of Figure 4 of Bland-Altman Plot. Assuming that the differences are normally distributed, the 1−α confidence interval of the mean difference is
![]()
and the endpoints of the confidence interval for the levels of agreement are
![]()
![]()
We see from range V6:Y8 of Figure 4 of Bland-Altman Plot, that the 95% confidence interval for the mean is [-.366, 3.396], while the 95% confidence interval for the levels of agreement is [-9.606, 12.636].
Examples Workbook
Click here to download the Excel workbook with the examples described on this webpage.
Links
References
Giavarina, D. (2015) Understanding Bland-Altman. Biochemia Medica
https://www.ncbi.nlm.nih.gov/pmc/articles/PMC4470095/
Bland, J. M. and Altman, D. G. (1986) Statistical methods for assessing agreement between two methods of clinical measurement. Lancet, 1986 pp 307-310
https://pubmed.ncbi.nlm.nih.gov/2868172/
Hi Charles,
I have a table that gives the mean +/- Std for the gold std, and the mean +/- Std for the comparator. Is it possible to compute LOAs from this data or do I need the raw data for each? The question is what to use for the Std, can you take just the average?
Thanks, Chris
Hi Chris,
If you have d-bar (mean), s_d, n, and alpha you should be able to calculate the confidence interval as shown on this webpage.
Perhaps you means something different by LOA. If so, please explain
Charles
Says above”We see from range V6:Y8 of Figure 4 of Bland-Altman Plot, that the 95% confidence interval for the mean is [-.366, 3.396], while the 95% confidence interval for the levels of agreement is [-9.606, 12.636].”
95%CI are -6.3 to 9.3 according to table
Hi Chris,
Are you saying that there is an error?
These calculations are a bit confusing since we create a confidence interval CI for the mean, and then confidence intervals of the lower and upper limits of CI.
Charles
Hi Charles
You suggested this page for a question that is asked about Nonparametric Bland Altman LoAs (as a reply to the question in the link: https://www.real-statistics.com/reliability/interrater-reliability/bland-altman-analysis/limits-of-agreement/)
But in this page there is normally distributed data aasumption.Is this suggestion correct for Nonparametric Bland Altman to find 2.5% and 97.5% quantile?
Hi Serkan,
The data doesn’t have to be normally distributed. The differences between the data points do have to be normally distributed, which is quite likely if you believe that the two techniques are likely to be equivalent.
Charles
Yes you right to say when comparing two methods measurements of two methods does not have to be normally distributed but their differences have to be normally distributed. But in my case differences are also not normally distributed. Therefore I need to Nonparametric Bland-Altman plot and 2.5 % and 97.5 % quantiles. The above equations assumes normally distributed differences. In this situation what I should do?
Serkan,
I am not sure, but perhaps bootstrapping can be used.
Charles
Thank you for this excellent website! Is there an algorithm to do a Bland Altman analysis for repeated measures?
/Jacob Karlsson
Real Statistics supports Bland Altman for comparison of a measurement against a standard measurement. If you are looking for multiple comparisons see
https://bjanaesthesia.org/article/S0007-0912(17)34715-3/fulltext
You can find more information by googling “bland altman repeated measures”
Charles
Many thanks!
Hi May I know whether can I use 99% of confident interval instead of 95% confident interval?
Hello Samuel,
Yes, you can use a 99% confidence interval. E.g. in Figure 4 of https://real-statistics.com/reliability/bland-altman-analysis/bland-altman-plot/ you would change the value in cell Q6 from .05 to .01.
Charles
Thanks so much!
Hi,
Maybe a stupid question,
Can You explain if I don’t make Bland and Altman plot but get the limits of agreement from the equation (mean difference + or – 1.96 SD )
Can I still report if there is agreement or bias between repeated measurement without visualizing the plot?
And is the range of LoA is dependent on sample size as well ?
Many thanx in advance !!
You can make the calculations shown on this webpage without creating the plot. But this may not be what you are really asking.
The range of LoA depends on the sample size, as described in the formula. Again, perhaps you are asking a different question that I am not understanding.
Charles