Context
In Total Least Squares, we show how to estimate the intercept a and slope b coefficients of a TLS regression model in two variables. In particular, the estimates for a and b are
![]()
where
Confidence Intervals
We now show how to estimate the standard errors and confidence intervals for these coefficients.
If sa and sb are the standard errors for the a and b coefficients, respectively, and tcrit is the 1–α critical value for the t distribution T(df) where df = n–2, the 1–α confidence intervals for each coefficient are
tcrit can be calculated in Excel by the formula =T.INV.2T(1-α,df) and the standard errors sa and sb can be estimated by
where
Example
Example 1: Find the 95% confidence intervals for the intercept and slope parameters for the TLS regression in Example 1 of Total Least Squares.
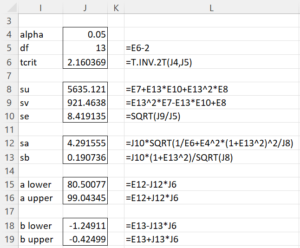
The standard errors and confidence intervals are calculated as shown in Figure 1 (with reference to cells in Figure 1 of Total Least Squares).
Figure 1 – Confidence intervals for TLS Regression
From the figure, we see that the standard errors for the intercept and slope are shown in cells J12 and J13. The corresponding 95% confidence intervals are shown in ranges J15:J16 and J18:J19.
Worksheet Function
Real Statistics Function: For an array or range R1 containing x values and R2 containing y values, the Real Statistics Resource Pack provides the following function.
TRegParam(R1, R2, lab, alpha) = 2 × 4 array consisting of the coefficient, standard error, and lower/upper ends of the 1-alpha confidence interval for the intercept and slope coefficients based on total linear regression using the data in R1 and R2.
The significance level alpha defaults to .05.
If lab = TRUE (default FALSE), then an extra column is appended to the output containing the labels “intercept” and “slope”. An extra row is also appended containing the labels “coeff”, “s.e.”, “lower”, and “upper”. The output from the formula =TRegParam(A4:A18,B4:B18,TRUE), with reference to the data in Figure 1 of Total Least Squares), is shown in Figure 2.
Figure 2 – TRegParam example
Comparison with a gold standard
TLS regression can also be used to determine whether two methods (especially two measurement techniques) yield similar results. This serves the same purpose as Passing-Bablok regression, Deming regression, Bland-Altman, or Lin’s Concordance Correlation Coefficient.
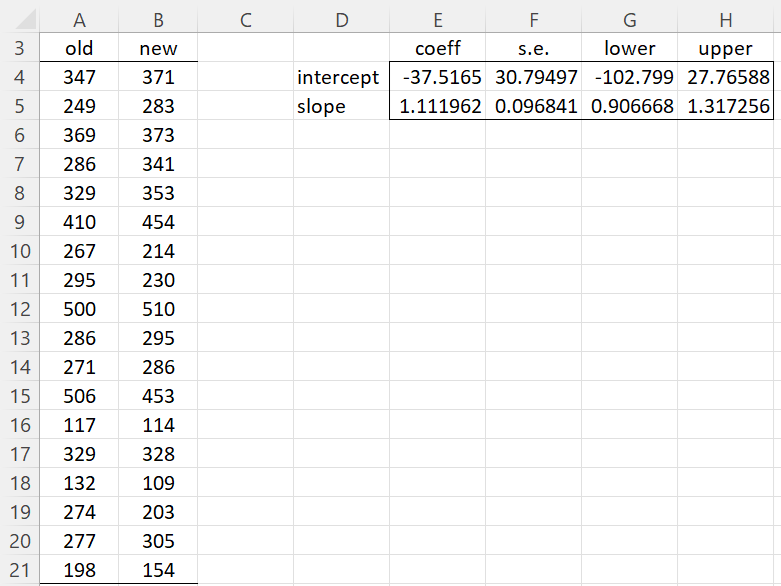
Example 2: A study was made to compare a newer, less expensive, method for creating precision machine tools. Using TLS regression, determine whether there is a significant difference between the quality of the two methods based on the data on the left-hand side of Figure 3.
The data is the same as that used in Example 1 of Lin’s Concordance Correlation Coefficient.
Figure 3 – Comparing two methods
We obtain the TLS regression results shown on the right side of the figure by inserting the array formula =TRegParam(A4:A21,B4:B21,TRUE) in range D3:H5. Since the 95% confidence interval for the intercept shown in G4:H4 contains zero and the 95% confidence interval for the slope shown in range G5:H5 contains one, we conclude there is no significant difference between the two methods. This provides grounds for using the newer, less expensive method.
Examples Workbook
Click here to download the Excel workbook with the examples described on this webpage.
References
Elcio Cruz de Oliveira and Paula Fernandes de Aguiar (2013) Least squares regression with errors in both variables: case studies
http://old.scielo.br/scielo.php?script=sci_arttext&pid=S0100-40422013000600025
Tellinghuisen, J. (2020) Least squares methods for treating problems with uncertainty in x and y. Anal. Chem. 2020, 92, 16, 10863–10871
https://pubmed.ncbi.nlm.nih.gov/32678579/
Mandel, J. (2018) Fitting straight lines when both variables are subject to error
https://www.tandfonline.com/doi/abs/10.1080/00224065.1984.11978881


