Basic Concepts
The Kendall-Theil-Sen estimator is a non-parametric method for fitting a line to a set of points (x1, y1), …, (xn, yn). It is a robust method in that it provides a better fitting line when the data contains outliers compared to ordinary least-squares regression. It also doesn’t require that the residuals are normally distributed. The key assumption is that there is a linear relation between the x and y data.
The approach consists of two parts. First, the slope is estimated and then the intercept is estimated based on this slope. The approach is similar to that described in Sen’s Slope for time series. In fact, if the time series is y1, y2, …, yn, then Sen’s slope is the Kendall-Theil-Sen slope estimator for the points (1, y1), …, (n, yn).
Methodology
The Kendall-Theil-Sen estimate of the slope m is defined as
We provide two approaches for estimating the corresponding intercept b.
Approach 1
where x-tilde is the median of the x values and y-tilde is the median of the y values (Conover).
Approach 2
Hypothesis Testing
The test to determine whether the slope coefficient is significantly different from zero is identical to the test to determine whether Kendall’s tau is significantly different from zero.
Confidence Interval
There are several ways of calculating the confidence interval of the slope, namely
Approach 1: Let N = the number of elements in S, zcrit = the 1-α/2 critical value for the normal distribution, and define
Then the lower and upper bounds of the slope coefficient are
where mh = the hth smallest element in S.
This is very similar to the way of estimating the confidence interval for Sen’s slope of a time series. In fact, we can refine the above estimate by using the tie correction for the standard error employed Sen’s slope (and the Mann-Kendall test) based on either the x or y values.
Approach 2: We can use a bootstrap approach to find a confidence interval based on the values in S.
Approach 3: We can use a bootstrap approach to find the standard error based on the values in S. Then we use m ± se ⋅ zcrit as the confidence interval.
Approach 4 and 5: We can use jackknifing instead of bootstrapping in approaches 2 and 3.
Example
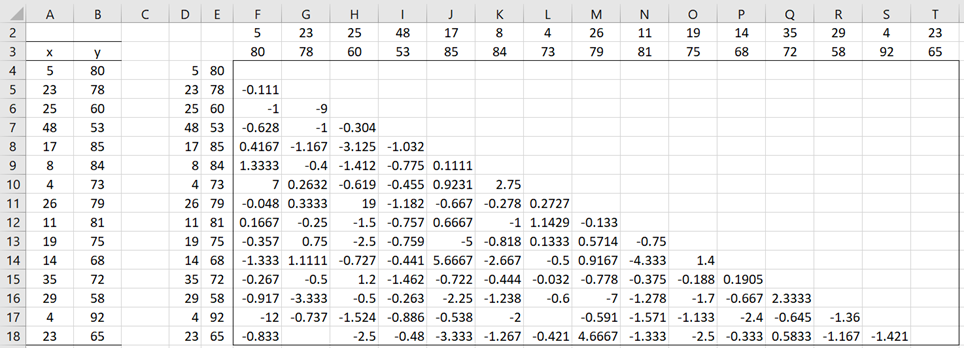
Example 1: Create a linear regression model for the data in columns A and B of Figure 1 using the Kendall-Theil-Sen estimate.
Figure 1 also displays all the pairwise slopes. E.g. cell F5 contains the formula
=IF(ROW(F5)-ROW(F$4)>COLUMN(F5)-COLUMN($F5),IF($D5<>F$2,($E5-F$3)/($D5-F$2),””),””)
Figure 1 – Slope for the regression model
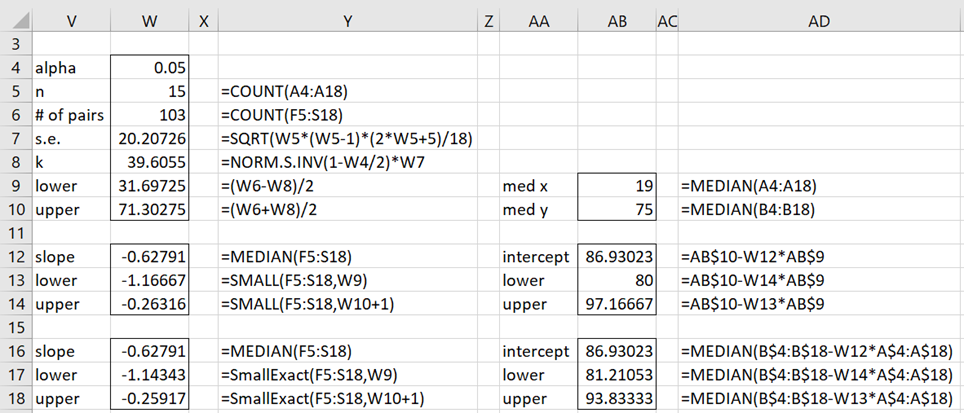
Figure 2 displays the regression model using the formulas described above. We see that the estimate for the slope coefficient is -.62791 (cell W12). A 95% confidence interval for this estimate is (-1.1667, -.26316), as shown in W13:W14. A slightly different estimate is shown in W17:W18 using Real Statistics’ SMALLExact function.
Figure 2 – Regression model
Figure 2 also provides two estimates for the intercept (cells AB12 and AB16). We also provide 95% confidence intervals using the two approaches. We see that the regression model is
y = -.62791x + 86.93023
Worksheet Function
Real Statistics Function: The Real Statistics Resource Pack provides the following function for the x data in Rx and y data in Ry.
KTSReg(Rx, Ry, lab, mopt, bopt, alpha): returns a column array with the values: slope, s.e. for the slope, intercept, and the confidence intervals of the slope and intercept
Rx and Ry must be column arrays or ranges with the same number of rows and no missing data or headings. If lab = TRUE (default FALSE) a column of labels is appended to the output. alpha is the significance level (default .05).
If mopt = TRUE (default), then SMALL is used to estimate the confidence interval for the slope; otherwise, SMALLExact is used. If bopt = TRUE (default), then the intercept is estimated using Approach 1; otherwise, Approach 2 is used.
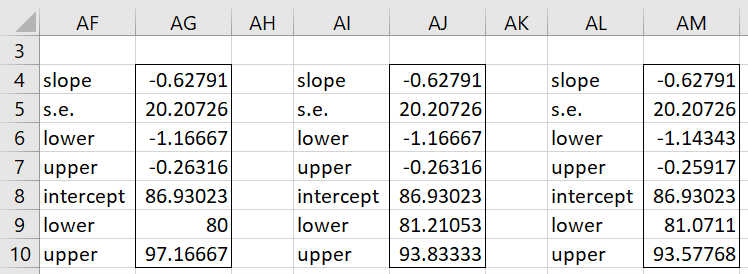
We can use this function to get the results for Example 1, as shown in Figure 3.
Figure 3 – Regression using KTSReg function
The formulas used to generate these three versions, from left to right, are
=KTSReg(A4:A18,B4:B18,TRUE)
=KTSReg(A4:A18,B4:B18,TRUE,,FALSE)
=KTSReg(A4:A18,B4:B18,TRUE,FALSE,FALSE)
Examples Workbook
Click here to download the Excel workbook with the examples described on this webpage.
References
Kvam, P. H., Brani Vidakovic, B. (2007) Nonparametric statistics with applications to science and engineering. Wiley
https://www.oreilly.com/library/view/nonparametric-statistics-with/9781119268130/
Sen, P. K. (1968) Estimates of the regression coefficient based on Kendall’s tau
https://www.pacificclimate.org/~wernera/zyp/Sen%201968%20JASA.pdf
Granato, GE (2006) Kendall-Theil Robust Line (KTRLine—version 1.0)—A Visual Basic program for calculating and graphing robust nonparametric estimates of linear-regression coefficients between two continuous variables
https://pubs.usgs.gov/tm/2006/tm4a7/
Farooqi, A., (2019) A comparative study of Kendall-Theil Sen, Siegel vs quantile regression with outliers
https://digitalcommons.wayne.edu/cgi/viewcontent.cgi?article=3351&context=oa_dissertations
Wikipedia (2023) Theil-Sen estimator
https://en.wikipedia.org/wiki/Theil%E2%80%93Sen_estimator


Hello, I’m having trouble with the KTS regression function in Excel. My data is in cells A1 to B4 (x and y values). When I use the function on just those four rows, it gives an error. But if I select a larger range with empty rows, it works.
This affects results like the standard error, which change depending on the selected range.
My question is: What’s the minimum number of data points required for the function to work Does it not accept only four?
Thanks!
Hello Lucia,
1. I just tried it with 2 independent variables and 5 rows of data, and it produced an error value.
I looked into the code and found that it was trying to find a confidence interval on 10 data elements based on a low end of just under 1 and a high end of just over 10. Since these are just outside the range [1, 10] Excel’s SMALL function returns an error. Note however that if you increase alpha just a little (from .05 to .06) then the function works without error. In fact, it even works with alpha = .05005.
2. Note that Excel’s SMALL function treats =SMALL(R1,1.9) the same as =SMALL(R1,1). Perhaps I need to treat =SMALL(R1,1.9) as =SMALL(R1,2).
3. The Real Statistics SMALLExact function overcomes this problem, except that =SMALLExact(R1,.9999) returns an error and not =SMALL(R1,1).
Charles
Thank you Charles!
Hello Charles,
Thanks for all your explanations! You really help me so much . Just a little thing with this exercise of Kendalss regression. In the Excel sheet the formula to estimate the upper interval with the Approach 1 do not have + 1 in the denominator, and you formula has it.
Thans for everything!
Hello Sebastian,
The formulas in cells W14 and W18 in the spreadsheet have the +1. Is this what you were referring to?
Charles
Hi Charles,
Thanks for your reply. I have a mistake because I was looking the position (W6+W8)/2 in cell W10, instead of the value corresponding to the position =K.ESIMO.MENOR(F5:S18,W10+1).
On the other hand, I would like to represent the 95% confidence intervals and 95% prediction intervals on the plot. How can I do this?
Hello Sebastian,
Perhaps you could duplicate the approaches described in the following webpages using the ouput from KTS regression:
https://real-statistics.com/regression/confidence-and-prediction-intervals/plots-regression-confidence-prediction-intervals/
https://real-statistics.com/excel-capabilities/chart-standard-errors/
Charles
Thanks Charles, I will try it!
In the last comment I mean the 95% confidence intervals and 95% prediction intervals of the regression line.
Thanks!