In Exponential Regression using a Linear Model we review Excel’s approach to exponential regression using linear regression. The Real Statistics Resource Pack provides a more accurate, nonlinear, exponential regression model.
Worksheet Functions
Real Statistics Functions: The following functions are provided in the Real Statistics Resource Pack. Here R1 contains a column range with the values for x and R2 contains a column range with the corresponding values for y.
ExpCoeff(R1, R2, iter, lab): when lab = FALSE (default) the output is a 2 × 4 range whose first row corresponds to the alpha coefficient (intercept) and whose second row corresponds to the beta value (slope). The first column contains the regression coefficients α and β, the second column contains the corresponding standard errors for these coefficients, the third column contains the SSE and MSE terms and the fourth column contains the SSReg (= MSReg) and dfT terms. When lab = TRUE an extra row is added which contains labels.
ExpPred(R, R1, R2, iter): an m × 1 column range with the values predicted by the exponential model for R1 and R2 based on the data in the m × 1 column vector of x values.
ExpPredC(R, α, β): an m × 1 column range with the values predicted by the exponential model with coefficients α and β based on the data in the m × 1 column vector of x values.
Here iter = the number of iterations (default 20). The last two functions can also be used as ordinary (i.e. non-array) functions of the form:
ExpPred(x, R1, R2, iter) = value predicted by the exponential model for x based on the data in R1 and R2
ExpPredC(x, α, β) = value predicted by an exponential model with coefficients α and β for x
Examples
Example 1: We now show how to use these functions on the data and output from Example 1 of Exponential Regression using Newton’s Method, as repeated in Figure 1 and 2.
Figure 1 – Data for Example 1
Figure 2 – Output for Example 1
The output from the array formula =ExpCoeff(A4:A14,B4:B14,,TRUE) is as shown in range I14:L16 of Figure 3.
Figure 3 – Output from ExpCoeff
Note that the labels in column H are not included in the output. Also note that the range P25:Q26 of Figure 2 contains the formula =ExpCoeff(A4:A14,B4:B14), with the output truncated to a 2 × 2 range not containing any labels.
Example 2: We next use the exponential regression model from Example 1 to predict the y values for x = 45 and 50.
The result is shown in Figure 4.
Figure 4 – Predictions using the Exponential Regression model
Referencing Figure 2, range O15:O16 can contain the array formula
=ExpPredC(N15:N16,P25,P26).
Alternatively, referencing Figure 1, range O15:O16 can contain the array formula
=ExpPred(N15:N16,A4:A14,B4:B14).
To just predict the y value corresponding to x = 45 alone we could insert either the non-array formula =ExpPredC(N15:N16,P25,P26) or =ExpPred(N15:N16,A4:A14,B4:B14) in cell O15.
Data Analysis Tool
Real Statistics Data Analysis Tool: The Real Statistics Resource Pack provides the Exponential Regression data analysis tool to automate the process of creating a non-linear exponential regression model.
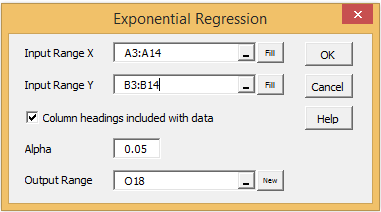
To create the model for Example 1, press Ctrl-m and select the Exponential Regression option from the Reg tab. (If using the original user interface, double click on the Regression option from the dialog box that appears.) Next, select the Exponential Regression option from the dialog box that appears and click on the OK button. Now fill in the dialog box that appears as shown in Figure 5.
Figure 5 – Exponential Regression dialog box
The output will be similar to that shown in Figure 2.
Examples Workbook
Click here to download the Excel workbook with the examples described on this webpage.
References
Foth, R. (2024) Modeling exponential relationships with regression
https://pimaopen.pressbooks.pub/topicsinmathematics/chapter/5-4-modeling-exponential-relationships-with-regression
Abramson, J. (2024) Exponential and logarithmic regressions
https://math.libretexts.org/Workbench/1250_Draft_3/06%3A_Exponential_and_Logarithmic_Functions/6.09%3A_Exponential_and_Logarithmic_Regressions
Libre Texts (2024) Nonlinear regression
https://math.libretexts.org/Workbench/Numerical_Methods_with_Applications_(Kaw)/6%3A_Regression/6.04%3A_Nonlinear_Regression
Geeks for Geeks (2024) Non-linear regression with examples
https://www.geeksforgeeks.org/non-linear-regression-examples-ml/


Hi Charles.
Thanks for the useful tool, however for any reason the Exponential functions are not available on the package I downloaded (I assumed that it is the latest version). I’m using Office 2016 on Mac. Using the CTRL+M toolbox interface, there is no Exponential Regression, only Logistic and Linear Regression. I also tried to type the formulae directly but Excel does not recognize it.
Do you have any idea what’s going on?
Thanks!
Hi Kleber,
The version on the Mac is older than the Windows version and so doesn’t contain Exponential Regression.
I don’t release versions for the Mac very often since I don’t own a Mac and need to borrow one to produce the release.
Charles
Thank you for coming up an exponential regression equation using the real stat. However, using that function, I did not see in the result the value of R Square. Does the value of R Square computed in Real Stat remain the same as computed in Excel?
Allan,
No, in general for non-linear regression models, there isn’t a definition of R-square that provides a goodness-of-fit measurement. For more details see
http://blog.minitab.com/blog/adventures-in-statistics/why-is-there-no-r-squared-for-nonlinear-regression
Charles