This webpage explains how to use Real Statistics’ Frequency Table data analysis tool.
Desc Tab
When you press the key sequence Ctrl-m or select the Real Statistics > Data Analysis Tools from the Add-Ins ribbon, the multipage user interface will appear, as shown in Figure 1.
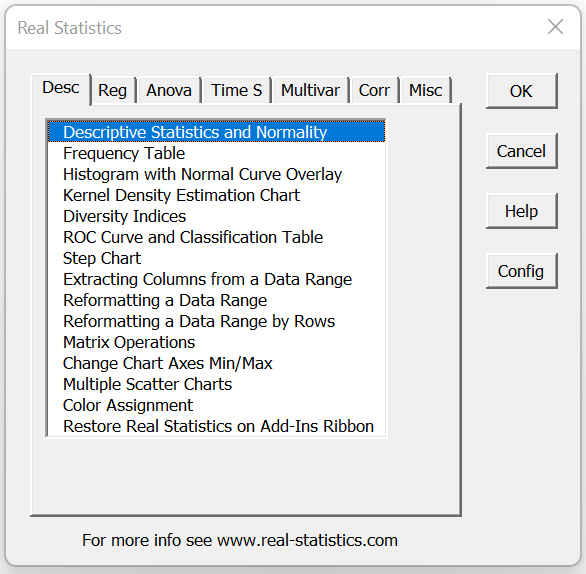
Figure 1 – Desc tab of the User Interface
Frequency Table
Now double-click on the Frequency Table option shown in Figure 1 to open the dialog box shown in Figure 2.
Dialog Box
The dialog box for the Frequency Table data analysis tool is shown in Figure 2. The values for Input Range and Output Range fields have already been filled in for the example described below. The defaults for all the other fields are displayed.
We next describe the data set used to illustrate how to use this data analysis tool, and then we describe all the fields shown on the dialog box in Figure 2.
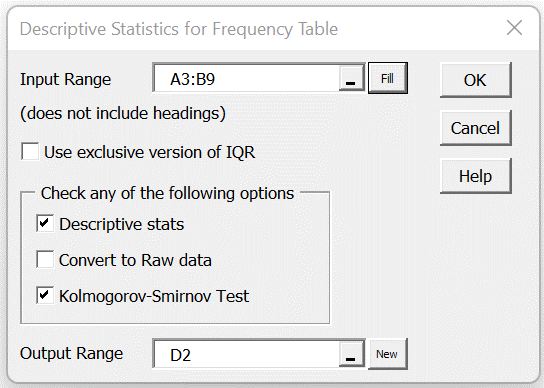
Figure 2 – Dialog Box
Example
Figure 3 displays the data that will be used to illustrate this data analysis tool. Range A3:B9 is the range used in the Input Range of Figure 2.
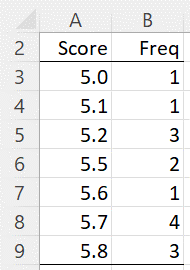
Figure 3 – Example data
Input Range
The Input Range field consists of a reference to a cell range. This range contains the input data without column headings.
The Input Range must have at least two rows of data and exactly two columns. The first column represents the data values and the second column represents the corresponding frequencies. The first column must contain numerical values and the second column can only contain positive integer values.
Use exclusive version of quartile
Excel supports two versions of the quartile function: the inclusive version, using the worksheet function QUARTILE.INC (or QUARTILE for older versions of Excel) and the exclusive version, using the worksheet function QUARTILE.EXC.
If this dialog box field is checked, then the exclusive version is used. If this field is not checked (default), the inclusive version is used.
The choice selected will impact the output for the Descriptive statistics option.
Options
You can select one or more of the three options (Descriptive stats, Convert to Raw data, and Kolmogorov Smirnov test). You must select at least one of the options or you will receive an error message. We will assume in the following that all the options are checked.
Descriptive stats
The output from this option on the data in Figure 3 is shown in Figure 4.
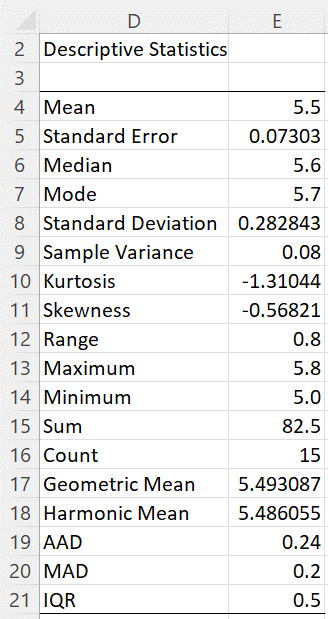
Figure 4 – Descriptive Statistics
Column E contains a variety of Excel and Real Statistics worksheet functions. These formulas are described in Figure 2 of Descriptive Statistics for Frequency Tables.
The formula in cell E21 is =IQR_FREQ(A3:A9,B3:B9,FALSE). If the Use exclusive version of quartile field in Figure 2 were checked, then the formula =IQR_FREQ(A3:A9,B3:B9,TRUE) would be used instead.
If you change any of the values in Figure 3, the values output in Figure 4 will change accordingly. Changing any of the values to a non-numeric value or replacing any of the values in column B with a non-integer value or negative may produce unexpected results. If you add additional elements to the data sets in Figure 3, these will not be considered.
Convert to Raw data
The output from this option on the data in Figure 3 is shown in Figure 5.
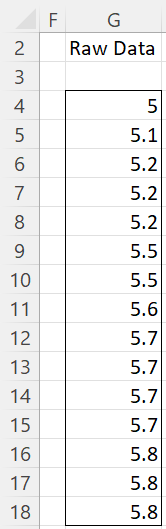
Figure 5 – Converting frequency table data to raw data
The data in range G4:G18 is based on the Real Statistics array formula =FREQ2RAW(A3:A9,B3:B9). See Descriptive Statistics for Frequency Tables.
If you change any of the values in Figure 3, the values output in Figure 4 will change accordingly. However, if you change the integer values in column B so as to increase the sum of the frequency values, then the list of raw data in column G will be truncated (although you can correct this by manually increasing the size of the output).
Changing any of the values to a non-numeric value or replacing any of the values in column B by a non-integer value or negative value may produce unexpected results. If you add additional elements to the data sets in Figure 3, these will not be considered.
Kolmogorov Smirnov Test
The output from this option on the data in Figure 3 is shown in Figure 6.
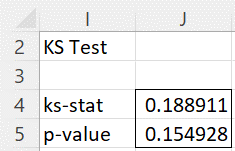
Figure 6 – KS test
Here cell J4 contains the Real Statistics worksheet formula =KSSTAT(A3:B9) and cell J5 contains the Real Statistics formula =LPROB(J4,SUM(B3:B9),,,,TRUE). Thus, the data analysis tool uses the Lilliefors version of the KS test, as described in Lilliefors Test for Normality. See also Real Statistics KS Test for Normality.
Since p-value = .154928 > .05 = alpha, we conclude that the data in the Frequency table in Figure 3 is normally distributed.
If you change any of the values in Figure 3, the values output in Figure 4 will change accordingly. Changing any of the values to a non-numeric value or replacing any of the values in column B with a non-integer value or negative value may produce unexpected results. If you add additional elements to the data sets in Figure 3, these will not be considered.