This webpage explains how to use Real Statistics’ Descriptive Statistics and Normality data analysis tool.
Desc Tab
When you press the key sequence Ctrl-m or select the Real Statistics > Data Analysis Tools from the Add-Ins ribbon, the multipage user interface will appear, as shown in Figure 1.

Figure 1 – Desc tab of the User Interface
Descriptive Statistics and Normality
Now double-click on the Descriptive Statistics and Normality option shown in Figure 1 to open the dialog box shown in Figure 2.

Figure 2 – Dialog Box
Dialog Box
The dialog box for the Descriptive Statistics and Normality data analysis tool is shown in Figure 2. The values for Input Range and Output Range fields have already been filled in for the example described below. The defaults for all the other fields are displayed.
We next describe the data set used to illustrate how to use this data analysis tool, and then we describe all the fields shown on the dialog box in Figure 2.
Example
Figure 3 displays the data that will be used to illustrate this data analysis tool. Range A2:C15 is the range used in the Input Range of Figure 2.
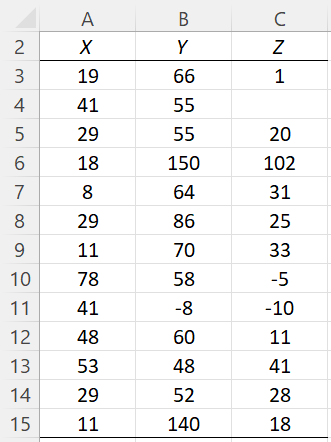
Figure 3 – Example data
Input Range
The Input Range field consists of a reference to a cell range. This range contains the input data and optionally column headings when the Column headings included with data field is checked.
The Input Range must have at least two rows of data (not counting any column headings). It can contain non-numeric data. Any non-numeric data, except for column headings, will be considered to represent missing data. Cell C4 in Figure 3 represents one missing data element.
The Input Range cannot contain any error data values (#NA, #NUM!, etc.).
Column headings included with data
This field is described above. The first row of the data in Figure 3 contains column headings, and so the Column headings included with data field is checked in Figure 2.
If you don’t want to include the column headings from Figure 3, you would uncheck the Column headings included with data field and change the Input Range in the dialog box in Figure 2 to A3:C15. In this case, instead of the column headings X, Y, Z, shown in A2:C2 being displayed, the headings Group 1, Group 2, Group 3 will be displayed.
Use exclusive version of quartile
Excel supports two versions of the quartile function: the inclusive version, using the worksheet function QUARTILE.INC (or QUARTILE for older versions of Excel) and the exclusive version, using the worksheet function QUARTILE.EXC.
If this dialog box field is checked, then the exclusive version is used. If this field is not checked (default), the inclusive version is used.
The choice selected will impact the output for the Descriptive statistics, Box Plot, and Box Plot w/ Outliers options.
Options
You can select one or more of the eight options (Descriptive statistics through Grubbs’ Test). You must select at least one of the options or you will receive an error message. We will assume in the following that all the options are checked.
The three options that relate to outliers, Box Plot w/ Outliers, Outliers and Missing Data, and Grubbs’ Test, require that you fill in a related field with a value that will be used to determine what is considered to be an outlier.
For the Box Plot w/ Outliers option, this field is labelled Outlier Multiplier. For the Outliers and Missing Data option, this field is labelled Outlier limit and for the Grubbs’ Test option, this field is labelled # of Outliers. Each is described subsequently; the default values are those shown in Figure 2.
Option Details
Click on the following for detailed descriptions of each of the eight options.