On this webpage, we describe in detail the Grubbs’ Test option of the Real Statistics Descriptive Statistics and Normality data analysis tool. We use the example data shown in Figure 3 of the Descriptive Statistics and Normality Tool, repeated in Figure 1 below.
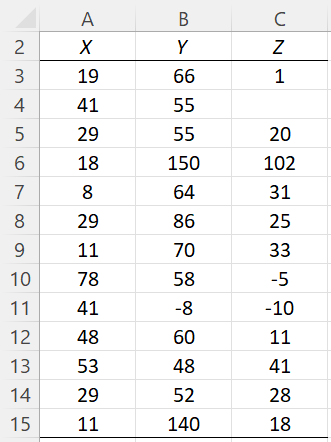
Figure 1 – Example data
Grubbs’ Test
The Grubbs’ test option provides yet another way to identify potential outliers. The maximum number of outliers that can be identified is specified by the # of Outliers field in Figure 2 of Descriptive Statistics and Normality Tool. It defaults to 1, but you can change it to any positive integer value.
When the # of Outliers field is 1, then Grubbs’ one-sided test is used. When this field contains a value greater than 1, the related (two-sided) ESD test is used.
The output from this option (starting with Rel 8.1.1), assuming that we have changed the # of Outliers field in Figure 2 of Descriptive Statistics and Normality Tool to 2, is shown in Figure 2.
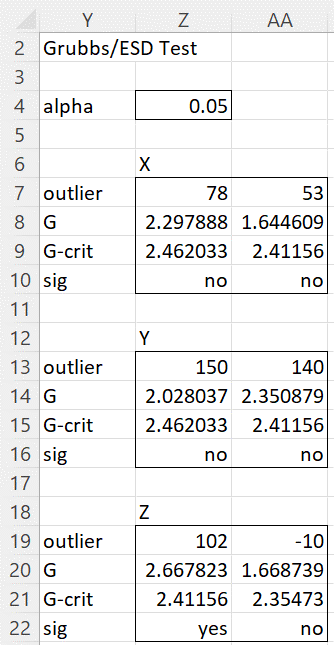
Figure 2 – Grubbs’ Test output
Observations
The figure shows a separate test for each of the three data sets. Since we set the # of Outliers field to 2, two values in each data set are tested, namely the two values in each data set that are furthest away from the mean for that data set. In general, potential outliers are listed in order from left to right based on their distance from the mean, with the farthest from the mean on the left.
We see from the figure that data sets X and Y have no outliers, while data set Z has one outlier, based on the ESD test, namely 102, the value in cell Z19. This is because cell Z22 contains the value “yes”, or equivalently that the test statistic G in cell Z20 is larger than the critical value in cell Z21.
Note that if the value in cell AA22 were “yes” then also -10 would be considered to be an outlier. In fact, if cell AA22 were “yes”, then 102 would be considered to be an outlier even if the value in Z22 were “no”.
Suppose the # of Outliers field was set to 4 and the outliers being tested were 200, 150, -20, 140. Suppose the ESD test shows that -20 is an outlier and 140 is not an outlier. We can conclude that 200 and 150 are outliers no matter which significance value, “yes” or “no”, is output for 200 and 150.
The critical values are based on the significance level shown in cell Z4. This value is initially set to alpha = .05, although you can change it to any value between 0 and .5, and the values in rows 9, 10, 15, 16, 21, and 22 will change accordingly.
Details
The values in Figure 2 are calculated using Real Statistics’ ESD function. E.g. range Y7:AA10 contains the array formula =ESD(A3:A15,TRUE,Z4). If you had set the # of Outliers field in Figure 2 to 1, then range Y7:Z10 would contain the array formula =GRUBBS(A3:A15,TRUE,Z4).
If you change any of the values in Figure 1 (including changing a numeric value to a non-numeric value or vice versa), the values output in Figure 2 will change accordingly. If you add additional elements to the data sets in Figure 1, these will not be considered.
See Identifying Outliers using t Distribution for more information about this test.