In Colors, we describe how to use the RGB color codes in Excel. We now describe how to code the various shades of the color grey (or gray) in Excel, and how to convert RGB colors to greyscale.
Basic Concepts
If the red, green, and blue components of an RGB code are all equal then the color represented is some shade of grey. The RGB code of all such shades of grey takes the form (2562 + 256 + 1) × k where k is an integer between 0 and 255. We will consider k to be the greyscale color (or shade) of any grey color. Here, k = 0 represents black and k = 255 represents white.
The color that we label “grey” in our 66-color palette (described in Colors) takes the value k = 128. Note that RGBCode(“grey”) = 8421504 = (2562 + 256 + 1) x 128. This value can also be obtained by using the formula =RedRGB(RGBCode(“grey”)). We, of course, get the same result if we replace RedRGB with GreenRGB or BlueRGB.
The higher the greyscale value the lighter the grey.
In addition to the 66 named colors, we can now add the colors “grey1”, “grey2”, …, “grey254”. The labels grey0, grey166, and grey255 can also be used, but they are equivalent to “black”, “grey”, and “white”.
Worksheet Function
Real Statistics Function: The Real Statistics Resource Pack provides support for the following worksheet function.
Convert2Grey(rgb1) = the code of the greyscale equivalent to the usual RGB code rgb1.
The NTSC (National Television System Committee) greyscale equivalent to a color with red, green, and blue components r, g, b is
.299r + .586g + .114b
Example
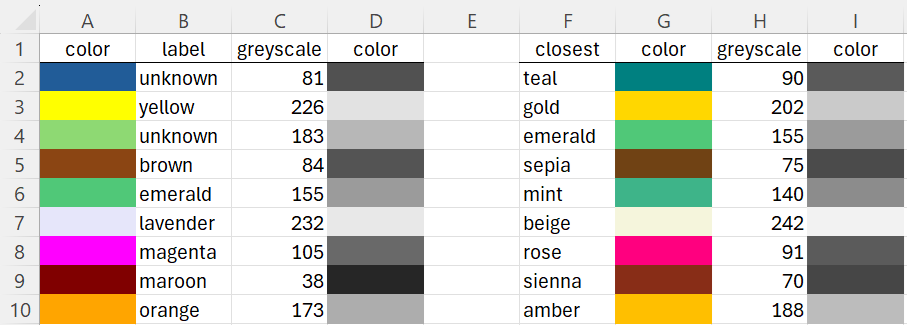
Example 1: Figure 1 shows the greyscale equivalent of several fill colors.
Figure 1 – Greyscale conversion
Cell B2 contains the formula =FillColor(A2), cell C2 contains the formula =Convert2Grey(FillRGB(A2)). Similarly, cell H2 contains the formula =Convert2Grey(FillRGB(G5)). See Colors for a description of the FillRGB worksheet function.
Cell F2 contains the formula =FillColor(A2,1), which returns the named color that is closest to the corresponding color in column A (excluding the original color itself if it is already a named color).
The colors in columns D, G, and I are inserted using the Color Assignment data analysis tool (see below).
Data Analysis Tools
The Real Statistics Resource Pack provides two data analysis tools that can be helpful with greyscale colors.
Real Statistics’ Color Assignment data analysis tool lets you fill in a cell with any color you like including any of the 256 shades of grey described above. To do this, you need to fill in the Greyscale field on the dialog box with the appropriate greyscale code 0-256 (or leave it blank for 128). See Colors for details.
Real Statistics’ Convert Image to Greyscale data analysis tool can be used to convert the fill colors of a range of cells to greyscale. See Coding an Image Analysis Tools for more details.
Examples Workbook
Click here to download the Excel workbook with the examples described on this webpage.
References
Dynamsoft (2019) Image processing 101 chapter 1.3: color space conversion
https://www.dynamsoft.com/blog/insights/image-processing/image-processing-101-color-space-conversion/
Wikipedia (2024) Grayscale
https://en.wikipedia.org/wiki/Grayscale
