You can also use the Scanning an Image and Painting an Image data analysis tools, described in Coding an Image Tools to compress an image.
Basic Approach
Suppose you have picture art that occupies a 112 × 140 range of cells. You can shrink the image by shrinking the range. E.g. if you want to place the image in a 28 × 28 cell range, then since 112/28 = 4 and 140/28 = 5, you need to map every 4 × 5 cell range in the original range to a single cell in the new range. Real Statistics does this by averaging the fill codes from the 20 cells in each 4 × 5 range and using this value as the fill code for the corresponding cell in the 28 × 28 cell range.
You can use the Scanning an Image data analysis tool to output the 28 × 28 array of fill codes. You can then use this array of codes as the input to the Painting an Image data analysis tool to obtain the image in reduced size.
Note that the above approach may change the aspect ratio for the new range. Two approaches for addressing this issue are (1) use a 28 × 35 range instead and (2) find a 112 × 112 subset of the original range that still contains the image under consideration and use it.
Note that if the original range is say 100 × 120 and you want to shrink it to a 28 × 28 range, then the Scanning an Image data analysis tool will only use the upper-left 84 × 112 range since it only shrinks by whole numbers (shrinking the height by 3 and the width by 4).
Worksheet Function
Compression is implemented using the following worksheet array function.
Real Statistics Function: The Real Statistics Resource Pack provides the following worksheet function for range R1.
CodeImage(R1, height, width, onerow, greyscale): when onerow = FALSE (default), then this function returns a height × width array with the RGB codes of each cell in R1 if greyscale = FALSE (default) or greyscale codes, 0-255, if greyscale = TRUE. Compression, as described above, is used if necessary.
When onerow = TRUE, then this function returns a row array with height × width columns with RGB or greyscale codes, as described above.
Example 1: Compress the 28 × 28 image on the left side of Figure 5 of Coding an Image Analysis Tools to a 14 × 14 image. The original image is shown in Figure 1 below.
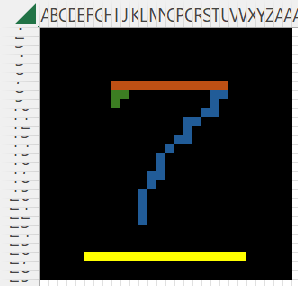
Figure 1 – 28 × 28 Color image
Using the array formula =CodeImage(A1:AB28,14,14) we obtain the output in Figure 2.
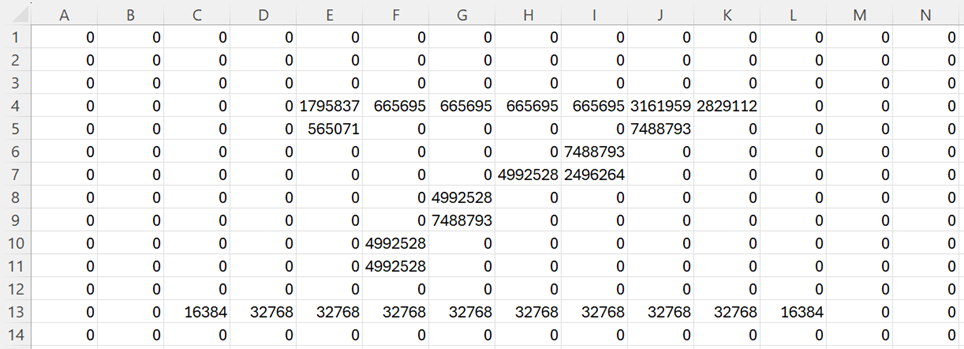
Figure 2 – 14 × 14 RGB codes
If we now use the Painting an Image data analysis tool with Height = 14 and Width = 14, we obtain the result shown in Figure 3.
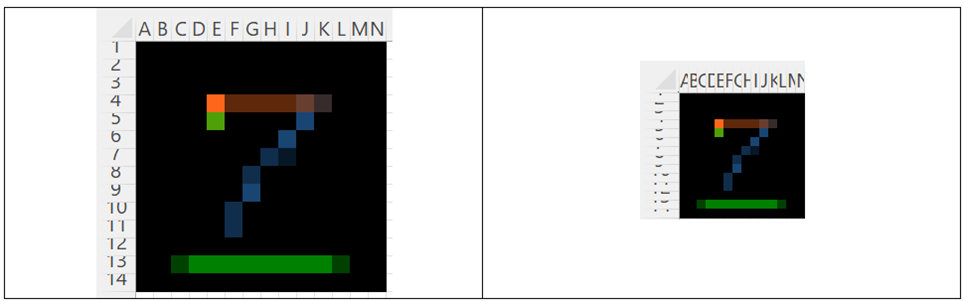
Figure 3 – 14 × 14 Image
Examples Workbook
Click here to download the Excel workbook with the examples described on this webpage.
References
McCaffrey, J. (2020) Displaying a grayscale image using Excel cells
https://jamesmccaffrey.wordpress.com/2020/05/11/displaying-a-grayscale-image-using-excel-cells/
Dynamsoft (2019) Image processing 101 chapter 1.3: color space conversion
https://www.dynamsoft.com/blog/insights/image-processing/image-processing-101-color-space-conversion/
Wikipedia (2024) Grayscale
https://en.wikipedia.org/wiki/Grayscale