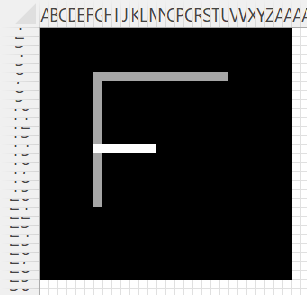
The Real Statistics Resource Pack will provide three data analysis tools that simplify the painting and coding of images on an Excel spreadsheet. We first show how to scan (i.e. code) the image in Figure 4 of Coding a Greyscale Image (repeated in Figure 1 below).
Figure 1 – Image on black background
Scanning an image
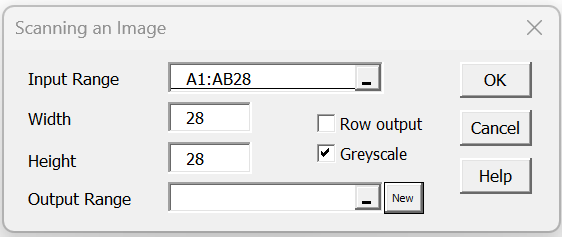
Press Ctrl-m, select the Scanning an Image data analysis tool from the Corr tab, and fill in the dialog box that appears as shown in Figure 2.
Figure 2 – Scanning an Image dialog box
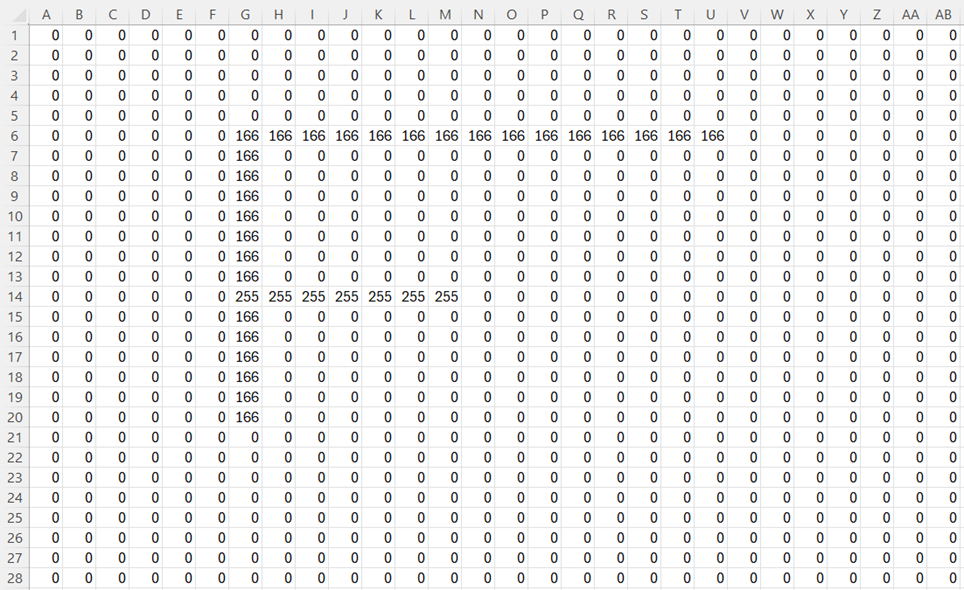
After clicking on the OK button, the output shown in Figure 3 is displayed.
Figure 3 – Scanned image
Since we checked the Greyscale option, the codes shown in Figure 3 are greyscale codes. If this option were not checked then the full RGB code would be used. In this case, for example, cell G6 would contain the code 166 × (2562 + 256 + 1) = 10921638.
Actually, the data analysis tool outputs the array formula =CodeImage(A1:AB28, 28, 28, FALSE, TRUE), as described in Compressing an Image.
Painting an image
You can feed the output shown in Figure 3 into the Painting an Image to obtain the original image.
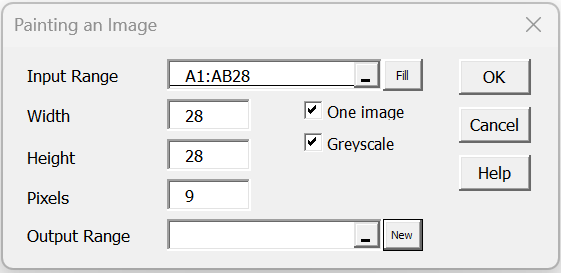
This is done by pressing Ctrl-m, choosing the Painting an Image option from the Corr tab, and then filling in the dialog box as shown in Figure 4.
Figure 4– Painting an image based on codes in Figure 3
Since the One image option is checked, the input contains the code for one image. In this case, the Width and Height values are ignored and are set to the # of rows and columns in the Input Range, respectively. Since the # of Pixels is set to 9, the row height and column width are set to 9 pixels. Also, since the Greyscale option is checked the Input Range contains greyscale codes.
The output is identical to the image shown in Figure 4.
Note that when the One image is not checked, it is assumed that each row in the Input Range represents one image of size Height × Width where each cell is a square of the specified Pixel size. Using this format, you can paint multiple images.
Converting a color image to greyscale
The left side of Figure 5 contains a color image.
Figure 5 – Converting an image to greyscale
We can use the Convert Image to Greyscale data analysis tool to obtain the image on the right side of Figure 5.
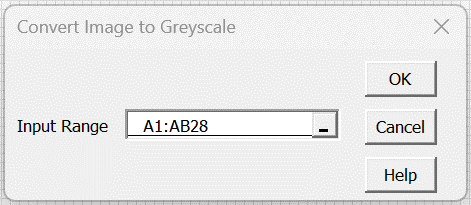
This is done by pressing Ctrl-m, selecting the Convert Image to Greyscale option from the Corr tab, and filling in the Input Range with the range where the color image appears.
Figure 5 – Dialog box
Note that the image in the Input Range is overwritten by the greyscale equivalent.
Examples Workbook
Click here to download the Excel workbook with the examples described on this webpage.
References
McCaffrey, J. (2020) Displaying a grayscale image using Excel cells
https://jamesmccaffrey.wordpress.com/2020/05/11/displaying-a-grayscale-image-using-excel-cells/
Wikipedia (2024) Grayscale
https://en.wikipedia.org/wiki/Grayscale
