We will assume that our image is written in greyscale. The intensity of the grey can be measured between 0 and 255, where 0 is black and 255 is white. See Colors for a further description.
For our purposes, we will assume that the image is placed over a 28 × 28 grid. Essentially, we are using “pixel art”. Thus, we can code the image as a 28 × 28 array containing integers between 0 and 255. Since 28 × 28 = 784, alternatively, we can code an image as a 1 × 784 row array containing integers between 0 and 255. In this way, we can code k images as a k × 784 row array where each row in the array represents one of the images.
Making Excel cells into squares
In fact, we can use Excel to represent such an image by reformatting Excel’s gridlines into small squares.
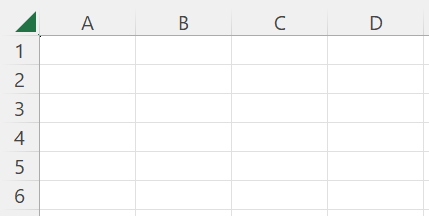
Figure 1 – Usual Excel worksheet cell sizes
For example, to make all the cells in a worksheet into 9 × 9 pixel squares, do the following:
- Click on the triangle in the upper-left corner of the worksheet (as shown in Figure 1).
- Using the mouse, move the cursor to the line between the A and B column headings until a tooltip of the form Width: 8.09 (96 pixels) appears. This shows the current width of the columns (and of the cells).
- Keeping the mouse button pressed, move the line between A and B to the left until a 9-pixel column width appears. Release the mouse button to fix the column widths at 9 pixels.
- Using the mouse, move the cursor to the line between the headings for rows 1 and 2 until a tooltip of the form Height: 14.50 (29 pixels) appears. This shows the current height of the rows (and of the cells).
- Keeping the mouse button pressed, move the line between rows 1 and 2 upward until a 9-pixel row height appears. Release the mouse button to fix the row height at 9 pixels.
The results are shown in Figure 2.
![]()
Figure 2 – Worksheet with 9 × 9 pixel cells
Creating a simple image
If you highlight range A1:AB28 and make the background for all the cells in the range black (by selecting Home > Font|Fill Color and clicking on Black), you obtain the results shown in Figure 3.
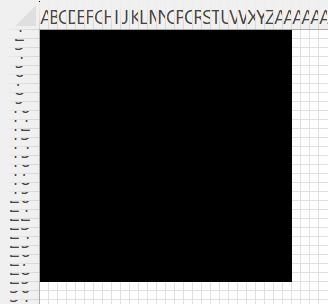
Figure 3 – Black 28 × 28 square
You can now fill in some of the small squares with grey fill colors to create an image, as shown in Figure 4.
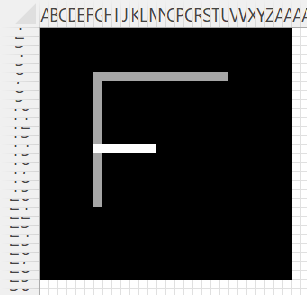
Figure 4 – Image on black background
Coding an image
The short horizontal line is white (i.e. Red = Blue = Green = 255), while the rest of the image is grey166 (i.e. Red = Blue = Green = 166) and the background is black (i.e. Red = Blue = Green = 0).
We can now code the image in Figure 4 as shown in Figure 5.
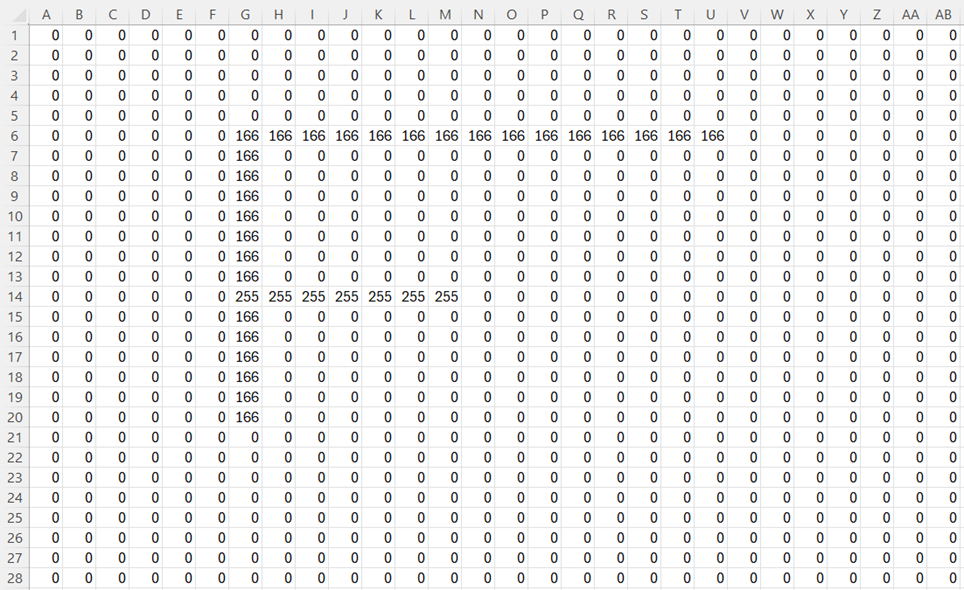
Figure 5 – Coding of the image in Figure 4
Examples Workbook
Click here to download the Excel workbook with the examples described on this webpage.
References
McCaffrey, J. (2020) Displaying a grayscale image using Excel cells
https://jamesmccaffrey.wordpress.com/2020/05/11/displaying-a-grayscale-image-using-excel-cells/
Wikipedia (2024) Grayscale
https://en.wikipedia.org/wiki/Grayscale