Introduction
In the simulation described in Single Server Queueing Simulation, each row represents a single customer that enters the system. We now demonstrate a different approach where each row represents an event.
Example
Example 1: Repeat Example 1 of Single Server Queueing Simulation using an event-driven simulation.
Step 1
We start by reformatting the input data from Figure 1 of Single Server Queueing Simulation. The first step is shown in Figure 1.
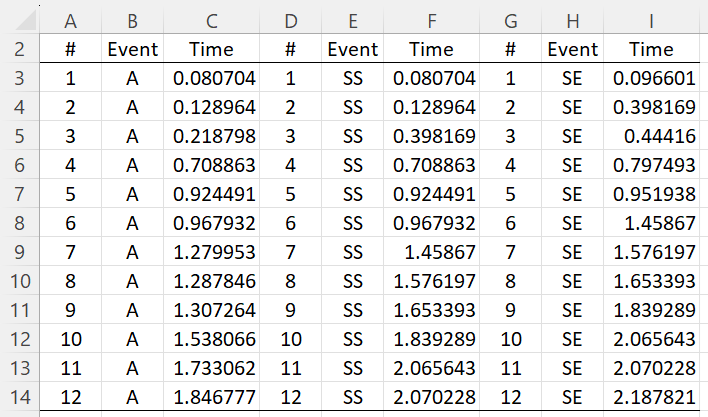
Figure 1 – Event-driven simulation (step 1)
The three events we want to track are the arrival time (A), the service start time (SS), and the service end time (SE). The data in columns C, F, and I of Figure 1 come from columns D, E, and F of Figure 1 in Single Server Queueing Simulation.
Step 2
We next reformat the nine columns in Figure 4 into three columns by placing the data in columns G, H, and I under columns D, E, and F, and then placing the data in columns D, E, and F under columns A, B, and C. Finally, we sort the resulting three columns by Time (column C), as shown columns O, P, and Q of Figure 2.
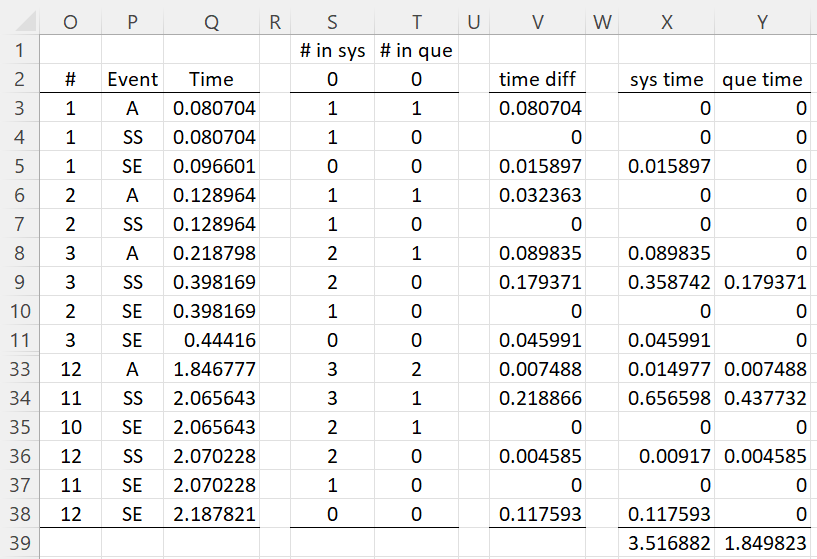
Figure 2 – Event-driven simulation (step 2)
Since there are 12 customers and 3 events, this figure has 36 data rows. Rows 12 through 32 are not displayed.
We have added additional columns to the figure to help us gain more information. The formulas for the 4th row are described in Figure 3. The other rows use similar formulas.
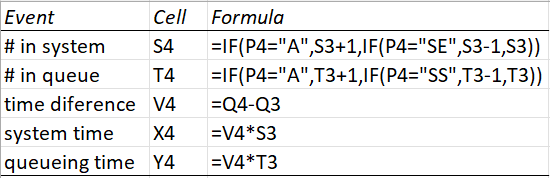
Figure 3 – Formulas from Figure 2
Let’s look specifically at the time between when customer 12 arrives (time 1.846777) and customer 11 starts getting service (time 2.065643), and interval of size .218866 (cell V34). Since there were 3 customers (cell S33) in the system, this accounts for 3 × .218866 = .656598 (cell X34) system time. There were 2 customers in the queue (T33) in the interval, accounting for 2 × .218866 = .437732 (cell Y34) of queueing time.
Step 3
Note that the sums in cells X39 and Y39 match the sums in cells I19 and G19 of Figure 1. We can now calculate L, Lq, W, and Wq as shown in Figure 4.
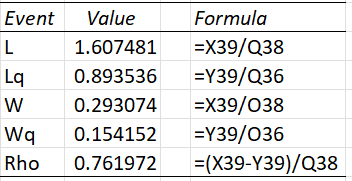
Figure 4 – L, Lq, W, Wq, ρ values
Here, Q38 in Figure 3 can be replaced by =MAX(Q3:Q38) and Q37 can be replaced by =MAX(IF(P3:P38=”SS”,Q3:Q38,””)). O36 and O38 can be replaced by similar formulas.
Examples Workbook
Click here to download the Excel workbook with the examples described on this webpage.
Reference
Leong, T-Y. (2007) Simpler spreadsheet simulation of multi-server queues. INFORMS Transactions on Education 7(2):172-177.
https://ink.library.smu.edu.sg/sis_research/215/