Basic Concepts
The M/M/s/N queueing model is the same as the M/M/s model except that now the population of customers is finite with N members. Alternatively, we can view the model as similar to the M/M/1/N model except that now there are s servers.
Properties
Using the notation found in Queueing Theory, we now present formulas for the key properties of this queueing model once a steady state is reached. As usual, we set τ = λ/μ.
For n ≤ s
For s ≤ n ≤ N
Of course, for n > N, pn = 0. Also
where
By Little’s Law
Example
Example 1: Calculate L, Lq, W, Wq, and pn for the M/M/s/N model with λ, μ, s, and N specified in column B of Figure 1.
The values for L, Lq, W, Wq, ρ, τ, and λ-bar are calculated on the right side of Figure 1. Column K contains a list of the formulas used in column G. The formula in cell G2 makes reference to cells in Figure 2, shown below.
Figure 1 – M/M/s/N queueing model (part 1)
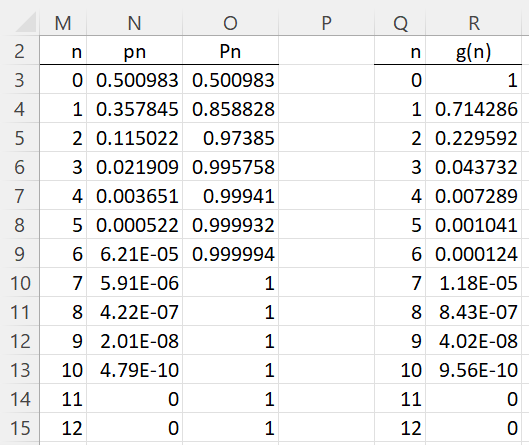
Figure 2 shows how to calculate the pn = the probability that n customers are in the system and Pn = the probability that at most n customers are in the system.
p0 in cell N3 is calculated via the formula =1/SUM(R3:R23). Here cell R3 contains the formula
=IF(Q3>B$5,0,(G$8/B$5)^Q3*COMBIN(B$5,Q3)*IF(Q3<B$4,1,PERMUT(Q3,Q3-B$4)/B$4^(Q3-B$4)))
The other formulas in column R are inserted by highlighting range R3:R23 and pressing Ctrl-D. Cell N4 contains the formula =N$3*R4. The other formulas in column N are inserted in a similar fashion by highlighting N4:N23 and pressing Ctrl-D.
Note that column R contains values for n = 0 to 20 (only values n = 0 to 12 are displayed). If N > 20 then we need to expand range R3:R23 to at least n = N. The situation is similar for column N.
Figure 2 – M/M/s/N queueing model (part 2)
Worksheet Functions
Excel Functions: The Real Statistics Resource Pack supports the following array function.
MMsN(λ, μ, s, nn, lab): returns a column array with the L, Lq, W, Wq, λ-bar in the steady state for the M/M/s/N queueing model with exponential arrival and service rates with mean arrival rate λ and mean service rate μ, and with s servers and a population of size nn.
If lab = TRUE (default FALSE) then an extra column of labels is appended to the output. In addition, the following non-array functions are also supported.
MMsNPn(λ, μ, s, nn, n, cum) = pn for the M/M/s/N queueing defined by s, nn, λ and μ if cum = FALSE (default) and Pn otherwise.
We can obtain the values in range F2:G6 of Figure 1 via the array formula =MMsN(B2,B3,B4,B5,TRUE). We can obtain the values in Figure 2 by inserting =MMsNPn(B$2,B$3,B$4,B$5,M3) in cell N3 and =MMsNPn(B$2,B$3,B$4,B$5,M3,TRUE) in cell O3, highlighting N3:O15, and pressing Ctrl-D.
Examples Workbook
Click here to download the Excel workbook with the examples described on this webpage.
References
Ross, S. M. (2014) Introduction to probability models, 11th Ed. Academic Press
https://ebin.pub/introduction-to-probability-models-11nbsped-0124079482-9780124079489.html
Sztrik, J. (2021) Basic queueing theory
https://irh.inf.unideb.hu/~jsztrik/education/16/SOR_Main_Angol.pdf
Shores, T. S. (2017) Queueing theory basics and models
No longer available online


