Basic Concepts
In the M/M/1 model, the queue is considered to be infinite in length. The M/M/1/K queueing model is equivalent to an M/M/1 queueing model except that the queue is finite, of length K–1. Thus, a maximum of K customers can be in the system. Essentially this means that the arrival rate is λ when there are fewer than K customers in the system but 0 when there are K customers in the system.
This model reflects the situation that when the waiting room is at full capacity, the customer cannot enter and goes away forever. Alternatively, it can be viewed as when the wait is too long (i.e. the queue is too long) the customer gives up and goes away.
Note that, unlike in the M/M/1 case, a steady state can be reached even when ρ ≥ 1.
Properties
Now, for ρ = λ/μ ≠ 1 and n = 0, 1, …, K, the probability that n customers will be in the system when it is in a steady state is
![]()
The average number of customers in the system is
![]()
When ρ = 1, these values are![]()
![]()
When ρ < 1, L → ρ/(1–ρ) as K → ∞, which is the result for an M/M/1 model.
The average number of customers waiting in the queue is
![]()
Little’s Law
As explained in Queueing Theory, we can calculate the average time in the system W and the average time in the queue Wq using Little’s Law.
![]()
where λn = λ for n = 0, 1, K-1, and λn = 0 for n ≥ K. Thus
![]()
Distribution of w and wq
The following formulas hold for M/M/1/K models in a steady state.


Example
Example 1: Calculate the various parameters for an M/M/1/K queueing model with λ = 25, μ = 40, and a queue with the maximum capacity of K = 12.
The results are shown in Figure 1.
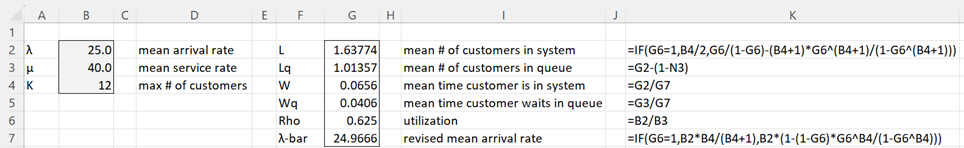
Figure 1 – M/M/1/K queueing model (part 1)
You can calculate p0 in cell N3 of Figure 2 by the formula
=IF(M3>B$4,0,IF(G$6=1,1/(B$4+1),(1-G$6)*G$6^M3/(1-G$6^(B$4+1))))
You can calculate the other pn values by highlighting N3:N18, and pressing Ctrl-D.
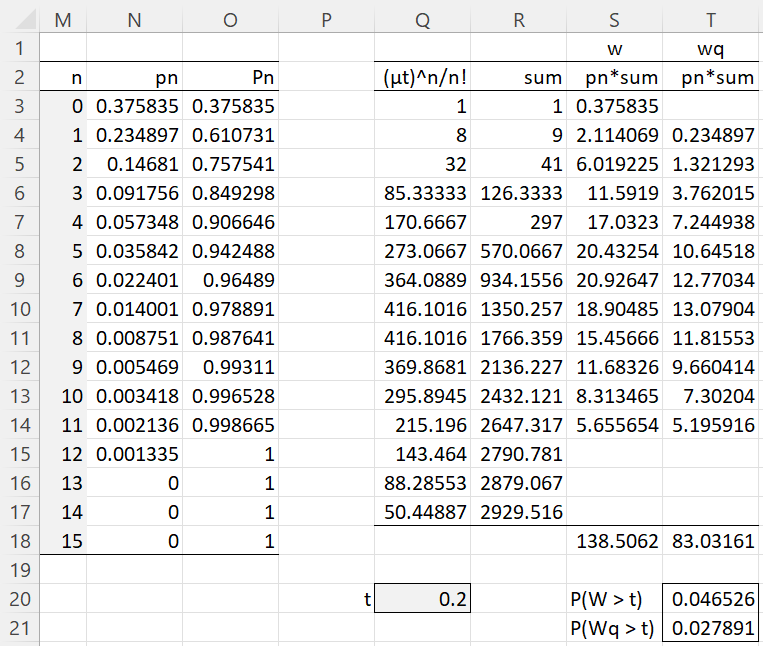
Figure 2 – M/M/1/K queueing model (part 2)
Cell Q3 contains the formula =(B$3*Q$20)^M5/FACT(M5), R4 contains =R3+Q4, and similarly for the other formulas in columns Q and R.
Cell S4 contains the formula =IF(M4<B$4,N4*R4,””) and T4 contains =IF(M4<B$4,N4*R3,””), and similarly for the other formulas in columns S and T.
You can calculate the value of P(w > t) in cell T20 for t = .2 (cell Q20) via the formula =S18*EXP(-B3*Q20)/(1-OFFSET(N3,B4,0,1,1)). Here, the formula =OFFSET(N3,B4,0,1,1) refers to the value pK in cell N15. Similarly, you can calculate the value of P(wq > t) via the formula =T18*EXP(-B3*Q20)/(1-OFFSET(N3,B4,0,1,1)).
Worksheet Functions
Excel Functions: The Real Statistics Resource Pack supports the following array function.
MM1K(λ, μ, k, lab): returns a column array with the L, Lq, W, Wq, ρ, λ-bar for the M/M/1/K queueing model with parameters K = k, λ and μ.
If lab = TRUE (default FALSE) then an extra column of labels is appended to the output. In addition, the following non-array functions are also supported.
MM1KPn(λ, μ, k, n, cum) = pn for the M/M/1/K queueing model defined by K = k, λ, and μ if cum = FALSE (default) and Pn otherwise.
MM1KW(λ, μ, k, t) = P(w > t) for the M/M/1/K queueing defined by K = k, λ, and μ
MM1KWq(λ, μ, k, t) = P(wq > t) for the M/M/1/K queueing defined by K = k, λ, and μ
We can obtain the values in range F2:G7 of Figure 1 via the array formula =MM1K(B2,B3,B4,TRUE). We can obtain the values in Figure 2 by inserting =MM1KPn(B$2,B$3,B$4,M3) in cell N3 and =MM1KPn(B$2,B$3,B$4,M3,TRUE) in cell O3, highlighting N3:O18, and pressing Ctrl-D.
Finally, we can obtain the other values in Figure 2 by inserting =MM1KW(B$2,B$3,B$4,Q20) in cell T20 and =MM1KWq(B$2,B$3,B$4,Q20) in cell T21.
Examples Workbook
Click here to download the Excel workbook with the examples described on this webpage.
References
Ross, S. M. (2014) Introduction to probability models, 11th Ed. Academic Press
https://ebin.pub/introduction-to-probability-models-11nbsped-0124079482-9780124079489.html
Sztrik, J. (2021) Basic queueing theory
https://irh.inf.unideb.hu/~jsztrik/education/16/SOR_Main_Angol.pdf
Shores, T. S. (2017) Queueing theory basics and models
No longer available online
Good Morning Mr. Zaiontz. The gates come in sections, each section contain 4 gates, so I am looking at 1 queue per section (12 gates = 3 sections) I hope this help and quite honestly I hope its the correct response.
Kind Regards Mr. Zaiontz and thank you.
Don Francis
Hello again Mr. Zaiontz. I hope I am not wasting your time but I appreciate your help. If I am taking up to much of your time I understand so please just let me know.
In regards to answering your questions I will do My best.
* I believe we have a separate queues for each gate.
* The service rate I don’t believe applies as we do not have any in this scenario.
To clarify my statement please see below and I apologies for the simplicity, I mean no disrespect.
If I am waiting in line at Disney Land to get into the park, how many lines would they have to open up to move 5000 people though at a rate of 9 seconds.
My problem: How do I calculate the number of gates needed to move the amount of people into the plant in a timely manner, lets say 30 Min.
See the calculations of the lost time cost impact below.
At 15 Min. delay per person x $85 per hour * 4 gate trips per days is a cost impact of $19,125,000. for a 45 day project or Turnaround event as well call it.
I hope this helps and any guidance is appreciated.
Kind Regards,
Don Francis
Hi Don,
1. If the service time were zero then there would be no queueing and so the wait time for each person would be zero. In your situation, the service time appears to be the time it takes an average person to get through the gate.
2. Let’s suppose for a moment that the four gates for any one section are next to each other so that a person can quickly transform from one queue to another. In this case, I will assume that you have one queue and 4 servers. You can use the M/M/4 queueing model.
Charles
Thank you for your response Mr. Zaiontz. I would prefer one Queues calculation for all gates if possible. If I understand the service rate correctly we are looking at 8 to 12 seconds per gate. keep in mind that we have hundreds some times thousands of people showing up at the gates at almost the same time. Example: 1,000 people arriving at 8 gates at the same time 6:00am and 6:00pm coming in and going out. The pass time through the a gate is 8 to 12 seconds per person if we have no obstructions once they have passed through the gate. Often we have a build up of people on the other side of the gate slowing the pass through time to almost 30 seconds. Hope this information helps.
Yes, this information is helpful. If you use an M/M/4 queueing model, then you need to determine the mean arrival rate and service rate. If you decide to model the peak time, then mean service time is somewhere between 8-12 and 30 seconds, say 20 seconds. Arrival rate is 500 per hour? per minute? Here, I am modelling one section consisting of 4 gates.
Since this model is only an approximation, you might better off using a simulation. The website shows how to do this for a simple case.
Charles
Good day Mr. Zaiontz, I have just came across M/M/1/K Queueing Model online and after looking a many examples I believe the one stated above is the closest to what I believe may help me resolve a dilemma. In a refinery turnaround (Large Maintenance effort) I have up to 5,000 workers per shift going through 8 to 16 badging gates. The lines created is costing us time and creating frustration among workers. My question to you Sir, is your model example the correct one for the lines that form at the gates. They can pass through a turnstile gate every 8 to 12 seconds and my efforts are to determine how many gates I need for the specific amount of people. I have seen so many examples but can not fined the right one to match my specific problems. Thank you for your time Sir.
Kind Regards
Don Francis
562-235-8207
Dfrancis5111@gmail.com
Hello Don,
The M/M/1/K has one queue that holds at most K-1 customers and one server that serves at most one customer.
With 8 to 12 gates, it is likely that you have 8 to 12 queues, which is different.
Please clarify whether there is one queue that handles all the gates or separate queues for each gate. Also what is the swervice rate?
Charles