Econometrics
Much of statistical analysis deals with the analysis of data from experiments based on the scientific method where information about a random sample is used to characterize a population from which the sample is derived. We will now focus on the analysis of historic data often collected from government sources or “big data” collected from such companies as Google, Facebook, or Amazon.
In particular, we will focus a lot of attention on economic data, using statistical techniques that come under the umbrella of econometrics, although many of the techniques are also appropriate to other sources of data (medical, sociological, political, etc.).
We are concerned with four types of data: cross-sectional data, time-series data, pooled cross-sectional data, and longitudinal (aka panel) data. Our principal focus will be on the analysis of panel data.
Cross-sectional data
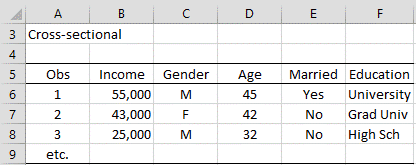
This is the type of data that is collected about individuals (people, countries, plants, etc.) over a single period of time or over various points in time where no special attention is paid to the time element. Data can be collected using sampling approaches or from historical data sources.
Figure 1 – Relationship between various factors and personal income
The order of the observations doesn’t play any role in the analysis, and, in particular, the roles are not related to time.
Time-series data
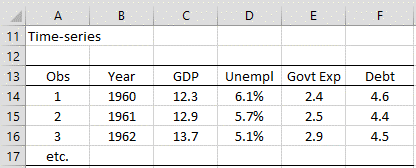
This type of data is explicitly organized in time sequence, generally in equally spaced units such as days, weeks, months, quarters, years, etc.
Figure 2 – Impact of various factors on GDP
Here, data are presented for a single individual (a country in this case) in time sequence order with one row of data for each year. Each row consists of the characteristics under study (GDP, unemployment rate, government expenditures, and national debt in Figure 2) for that year.
Pooled cross-sectional data
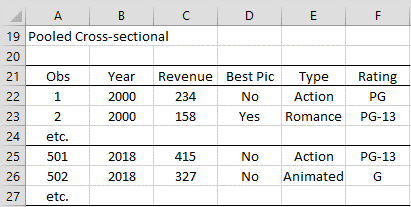
This type of data combines some of the features of cross-sectional and time-series data. Figure 3 shows the films in 2000 and 2018 that grossed more than $10 million in revenues. There were 500 such films in 2000 and 523 in 2018. Each row contains various characteristics of these films (the revenues, whether it won an academy award for best picture, the type of film, and its audience rating).
Figure 3 – Films in 2000 compared with those in 2018
Note that the films in 2000 are different from the films in 2018. Often, this type of data is used to study the impact of some policy or societal change.
Panel (Longitudinal) data
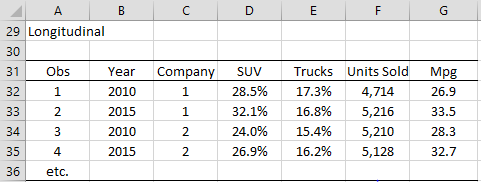
Panel data consists of time-series data for each cross-sectional individual. Once again, individuals can be people, cities, companies, plants, etc. and time can be years, months, weeks, etc. Figure 4 shows the impact of higher fuel standards (in miles per gallon) in 2015 from those in 2010 on auto manufacturers.
Figure 4 – Impact of higher miles per gallon standards
Unlike in pooled cross-sectional data, here the same individuals or units (auto companies in Figure 4) have rows for different time periods. Although the data in Figure 4 contains two time periods per individual, there can be many more time periods. In a balanced model, for each individual, there will be one row for each time period being studied. See Panel Data Over Two Time Periods for more details.
References
Greene, W. H. (2002) Econometric analysis. 5th Ed. Prentice-Hall
https://www.ctanujit.org/uploads/2/5/3/9/25393293/_econometric_analysis_by_greence.pdf
Gujarati, D. & Porter, D. (2009) Basic econometrics. 5th Ed. McGraw Hill
http://www.uop.edu.pk/ocontents/gujarati_book.pdf
Hill, R. C., Griffiths, W. E., Lim, G. C. (2018) The principles of econometrics. 5th edition. Wiley.


Thank you for providing the detailed information. It has been incredibly helpful in guiding my decisions and making things better.
Thanks for the great information, i have used the info in my research. I’m at Makerere University, Uganda.
Glad I could help, Andy.
Charles