Worksheet Functions
Real Statistics Functions: The Real Statistics Resource Pack provides the following spline fit function. Here, Rx and Ry are column arrays with the same number of rows containing the x and y values of the points (x0, y0), …, (xn, yn). These are the points through which the spline curve passes and which define the spline curve. R0 is a column array containing x values (usually between the smallest and largest values in Rx).
SPLINE(R0, Rx, Ry): returns a column array with the same number of rows as R0 consisting of the y values that correspond to the x values in R0 and which lie on the spline curve.
For Example 1 of Spline Fitting, the array worksheet formula =SPLINE(K4:K17,B4:B7,C4:C7) returns the values shown in range L4:L17.
The Real Statistics Resource Pack also supports the following related array function where incr is a positive numeric value.
SPLINE0(incr, Rx, Ry): returns a two-column array whose first column R1 contains the values x0, …, xm. Here, x0 = the smallest value in Rx, xm = the largest value in Rx, and for all i, xi = xi-1 + incr. In addition, all the values in Rx, excluding the smallest, are inserted in this column in sorted order (with repeated values if necessary). The second column R2 contains the corresponding spline values, i.e. R2 = SPLINE(R1, Rx, Ry).
For Example 1 of Spline Fitting, the worksheet array formula =SPLINE0(1,B4:B7,C4:C7) produces the output in range K4:L17. This time, though, the (x, y) values in rows 7, 15, and 17 are listed twice.
Interpolation
You can also use the SPLINE function to interpolate between two of the values in Rx. E.g. to interpolate the y value corresponding to x = 8 (between x = 5 and x = 13), we use the formula =SPLINE(8,B4:B7,C4:C7) to obtain the value 2.243767 (as shown in cell L10 in Figure 3 of Spline Fitting).
Data Analysis Tool
Real Statistics Data Analysis Tool: The Real Statistics Resource Pack also supports the Spline Fit data analysis tool which creates a spline curve that fits the input data.
Example 1: Use the Spline Fit data analysis tool to create a spline curve for the (x,y) points in range A4:B8 of Figure 1.
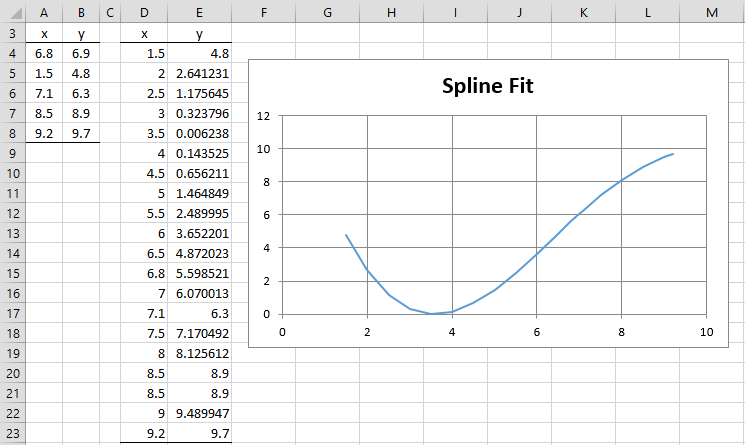
Figure 1 – Spline Fit data analysis
You can accomplish this by pressing the key sequence Ctrl-m and selecting the Spline Fit data analysis tool from the Misc tab. Next, fill in the dialog box that appears as shown in Figure 2. Alternatively, you can insert A4:A8 in the Input Range X field and B4:B8 in the Input Range Y field. After clicking on the OK button, the output shown on the right side of Figure 1 appears.
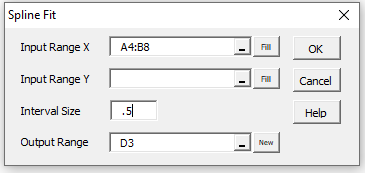
Figure 2 – Spline Fit dialog box
Note that the x values displayed in column D are .5 units apart, except that data points that define the spline curve, excluding the smallest, are inserted (i.e. x = 6.8, 7.1, 8.5, and 9.2). Note that since x = 8.5 occurs in the regular order (.5 units after 8.0) as well as in the original data, it appears twice (in rows 20 and 21).
Examples Workbook
Click here to download the Excel workbook with the examples described on this webpage.
Links
↑ Spline fitting and interpolation
References
Chen, M-Q (2013) Cubic spline interpolation
The link is no longer available.
Jameson, A. (2019) Cubic splines
The link is no longer available.
Dunbar D. (2001) Cubic spline (Excel VBA implementation)
The link is no longer available.
Huettig, A. (2020) Linear and cubic splines
https://iu.pressbooks.pub/abigailehuettig/chapter/linear-and-cubic-splines
Wikipedia (2019) Spline interpolation
https://en.wikipedia.org/wiki/Spline_interpolation