Given a collection of points in r-space, i.e. 1 × r row vectors, we can find a minimum spanning tree for the fully-connected graph whose nodes are the points in the collection and whose edges are all the pairwise connections between these points. The weight for each edge is the distance between the points that constitute the edge. Here, we generally use the Euclidean distance, although we could use other distance metrics.
Worksheet Function
Real Statistics Function: The Real Statistics Resource Pack contains the following array function where each row in R1 represents a 1 × r vector (i.e. r = the number of columns in R1). We consider the row number of each row in R1 as the label for the nodes in the graph. Thus, the nodes are 1, 2, …, n where n = the number of rows in R1.
MSTVectors(R1, brief, p, Rw): returns an n-1 × 3 array where each row in the output consists of two nodes (i.e. row numbers for rows in R1) that represent an edge in MST for R1 followed by the distance between the nodes (assuming brief = FALSE, the default).
The output is the same when brief = TRUE except that the weights (i.e. the distance values) are not included. This means that the output is an n-1 × 2 array. The Prim algorithm is used to implement this worksheet function.
This function supports weighted and unweighted Minkowski distances based on the values in p and Rw (see Lp Estimators and Minkowski Distance). When Rw is omitted, then the unweighted Minkowski distance between X = (x1, …, xr) and Y = (y1, …, yr) is
But, when p = 2 (default), this is equivalent to the Euclidean distance. When p = 1 this is the Manhattan distance. When Rw is present, then it takes the form of a column array with r rows that provide the weights W = (w1, …, wr) for calculating the weighted Minkowski distance (see Weighted Minkowski Distance). In this case, the distance between X and Y is
where w = the sum of the wi.
Example
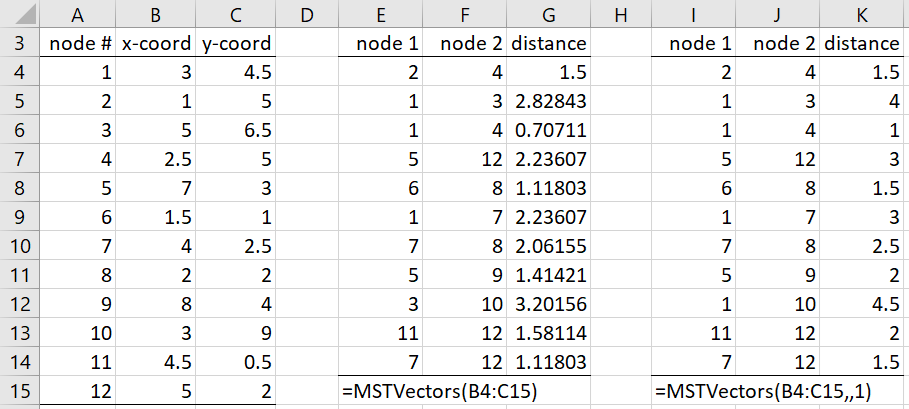
Example 1: Find the minimum spanning tree for the fully connected graph whose nodes are the rows in range B4:C15 of Figure 1.
Figure 1 – MST for (x,y) points
Note that each row represents a point (x, y) in two-dimensional space. We use the Euclidean distance to obtain the minimum spanning tree shown in E4:G14 of the figure. If we use the Manhattan distance, we obtain the results shown in F4:K14.
Network Diagrams
Click here to see how to draw the graphs defined in Figure 1 using Excel’s charting capabilities.
Examples Workbook
Click here to download the Excel workbook with the examples described on this webpage.
Reference
Cormen, T. H., Leiserson, C. E., Rivest, R. L. (1992) Introduction to algorithms. MIT Press.
https://mitpress.mit.edu/books/introduction-algorithms-third-edition
Wilson, R. J. (1996) Introduction to graph theory. 4th ed. Prentice Hall
https://webhomes.maths.ed.ac.uk/~v1ranick/papers/wilsongraph.pdf
