Basic Concepts
The exponential distribution (aka the negative exponential distribution) can be used to determine the probability that it will take a given number of trials to arrive at the first success in a Poisson distribution; i.e. it describes the inter-arrival times in a Poisson process. It is the continuous counterpart to the geometric distribution, and it too is memoryless.
Definition 1: The exponential distribution has the probability density function (pdf) given by
f(x) = λe-λx
for x ≥ 0. Lambda is called the rate parameter and λ > 0.
The cumulative distribution function (cdf) is
F(x) = 1 – e-λx
The inverse cumulative distribution function is
F-1(p) = – ln(1–p)/λ
Worksheet Functions
Excel Function: Excel provides the following function for the exponential distribution:
EXPON.DIST(x, λ, cum) = the pdf of the exponential function f(x) when cum = FALSE and the corresponding cumulative distribution function F(x) when cum = TRUE.
This function is not available in versions of Excel prior to Excel 2010. Instead, these versions of Excel use the equivalent function EXPONDIST.
Observation: The exponential distribution is equivalent to the gamma distribution with α = 1 and β = 1/λ. Thus, EXPON.DIST(x, λ, cum) = GAMMA.DIST(x, 1, 1/λ, cum).
There is no EXPON.INV(p, λ) function in Excel, but GAMMA.INV(p, 1, 1/λ) or –LN(1–p)/λ or the following Real Statistics function can be used instead.
Real Statistics Function: The Real Statistics Resource Pack supplies the following function.
EXPON_INV(p, λ) = the inverse of the exponential distribution at p
Graph
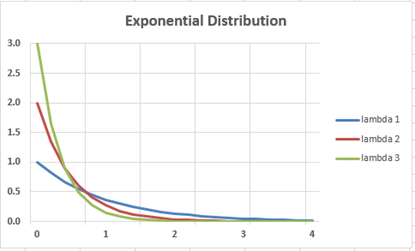
Figure 1 shows a graph of the pdf of the exponential distribution for λ = 1, 2 and 3.
Figure 1 – Pdf of exponential distribution
Properties
Key statistical properties are:
- Mean = 1 / λ
- Median = ln 2/λ
- Mode = 0
- Range = [0, ∞)
- Variance = 1 / λ2
- Skewness = 2
- Kurtosis = 6
If λ is a constant representing the average number of random events that occur in a fixed time interval, then the probability that the first such event will occur in less than x time is given by the cumulative exponential distribution function F(x).
Property 1: An exponential distribution is memoryless
Property 2: If x has a Poisson distribution with mean λ, then the time between events follows an exponential distribution with mean 1/ λ.
Click here for the proofs of these two properties.
Related Distributions
- If x ∼ Laplace(μ, β), then |x – μ| ∼ Exp(1/β)
- If x ∼ Pareto(α, 1), then ln x ∼ Exp(α)
- If x ∼ Exp(λ), then x ∼ Weibull(1/λ, 1)
- If x ∼ Exp(λ), then x2 ∼ Weibull(1/λ2, 1/2)
- If x ∼ Exp(λ), then e-x ∼ Beta(λ, 1)
- If x ∼ Exp(λ), then kex ∼ Pareto(λ, k)
Examples
Click here for examples based on the exponential distribution.
Examples Workbook
Click here to download the Excel workbook with the examples described on this webpage.
Reference
Wikipedia (2012) Exponential distribution
https://en.wikipedia.org/wiki/Exponential_distribution

Hi Charles,
This is a massive help. I think its exactly what I’ve been looking for.
I want to conduct a simulation and I think part of it should be from the exponential dist.
I’m simulating a utility over time. The utility value will be on the beta dist.
The utility is inferred to be constant over time, so I plan to draw from the exponential dist on excel for the time period.
I will use: LN(1 – RAND()) / -λ
Do you think this approach sounds correct?
Would you have any references for this?
Many thanks
B
Or should I just use the method of moments and the gamma distribution, with the GAMMA.INV function? This seems to be giving me more plausible simulations
You can also use the maximum likelihood (MLE) approach.
Charles
I don’t have enough information to be able to say whether this is the right approach or not.
Charles
Instead of using the Gamma.inv function, we can use the following formula:
= LN(1 – RAND()) / -λ
for simulation for an F(x) = RAND(), when we want to find the ‘x’.
Thanks for sharing this. This works since the inverse of the exponential distribution is -LN(1-p)/λ.
Charles
How can you test if a set of real data follows an exponential distribution?
Lemon,
See https://real-statistics.com/non-parametric-tests/goodness-of-fit-tests/
and especially https://real-statistics.com/non-parametric-tests/goodness-of-fit-tests/anderson-darling-test/
Charles
I need help about (How compute skweness and kurtosis of Bivariate exponential distribution)
Fadhil,
Sorry, but this website doesn’t yet support the bivariate exponential distribution.
Charles
if I have bivariate case of exponential distribution How compute skeness & kurtosis
in Matlab or Rpackage
thank you
Sorry, but I don’t use Matlab or R. This website focuses on Excel.
Charles
Dear frinds
Give me help
I need a real data set in any field that have exponential distribution.
size of data should be at least 300
Sorry, but I don’t have such real data.
Charles
how do I generate an expected values for Chi square goodness of fit using negative exponential distribution in excel
If you are using the Chi-square goodness of fit test to check whether your data is a good fit for a negative exponential distribution, you can follow the approach shown in Example 4 of the webpage https://real-statistics.com/chi-square-and-f-distributions/goodness-of-fit/.
This Example tests the fit for a Poisson distribution. Use the EXPON.DIST formula instead of the POISSON formula.
Charles
how to analyse my time series data using spss
Sorry, but I don’t use SPSS and so can’t advise you about that. The website is oriented towards statistics using Excel.
Charles