Joint Probability Distribution
Pdf and Cdf for first and last
Property 1: Let F1,n(x,y) be the joint distribution function for the first and last order statistic for a sample of size n taken from a population with cdf F(x). Then for x < y
![]()
Proof:
![]()
By Property 1 of Distribution of Order Statistics from a Continuous Distribution, the cdf of the nth order statistic is
![]() We now have
We now have
![]()
![]()
Property 2: Let f1,n(x,y) be the joint pdf function for the first and last order statistic for a sample of size n taken from a population with cdf F(x) and pdf f(x). Then
![]()
if x < y. Otherwise, f1,n(x,y) = 0.
Proof: Click here for the proof that uses calculus.
Pdf and Cdf general case
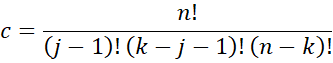
Property 3: Let fj,k(x,y) be the joint pdf function for the jth and kth order statistic for a sample of size n taken from a population with cdf F(x) and pdf f(x). Then
![]()
if x < y and j < k. Otherwise, fj,k(x,y) = 0.
Observation: When j = 1 and k = n, by Property 3
![]()
![]()
which is the same result we obtained in Property 2.
Property 4: Let Fj,k(x,y) be the joint distribution function for the jth and kth order statistic, with j < k, for a sample of size n taken from a population with cdf F(x) and pdf f(x). Then for x < y

and for y ≤ x
![]()
Proof:
![]()
![]()
![]()
![]()
Range Distribution
The range of a sample of size n is x(n) – x(1). This definition can be extended to x(k) – x(j).
The rest of this webpage uses notation from integral calculus. For those of you who are not familiar with calculus, you can view the notation on the left of the following equality as equivalent to the term on the right.

Here a can also take the value -∞ (i.e. no constraint on the left) and b can take the value +∞ (i.e. no constraint on the right). We also define a function p(w) of the following form:
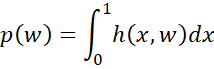 In this case, for each value of w, p(w) is defined as the area under the curve y = h(x, w) between the x-axis and x = 0 and x = 1.
Finally, note that these integrals can be evaluated using the Real Statistics INTEGRAL worksheet function (see Numerical Integral Functions)
Range pdf
Property 5: The pdf g(w) of w = x(k) – x(j) is equal to
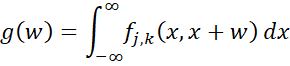

where
Observation: Based on Properties 2 and 5, the pdf of w = x(n) – x(1) is equal to

where F(x) is the cdf of the population and f(x) is the pdf of the population. A refinement is provided in Property 6.
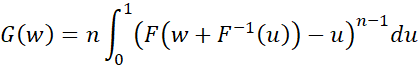
Property 6: The pdf g(w) of w = x(n) – x(1) is equal to
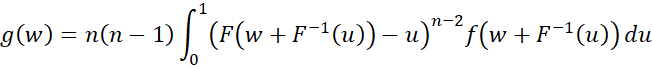
Proof: Click here for the proof that uses calculus.
Range cdf
Property 7: The cdf of w = x(n) – x(1) is equal to
![]()
or equivalently
Proof: Click here for the proof that uses calculus.
Worksheet Functions
Real Statistics Functions: The Real Statistics Resource Pack supports the following worksheet functions. These functions refer to a distribution dist (“uniform”, “normal”, etc.) with the specified parameters as described for the MEAN_DIST and VAR_DIST functions (see Distribution Property Functions).
ORDER2_DIST(x, y, j, k, n, cum, dist, param1, param2, param3) = the pdf at (x, y) for the jth and kth order statistic from a sample of size n for the specified distribution if cum = FALSE and the corresponding cdf F(x) if cum = TRUE.
RANGE_DIST(x, j, k, n, cum, iter, dist, param1, param2, param3) = the pdf at x for the range x(k) – x(j) from a sample of size n for the specified distribution if cum = FALSE and the corresponding cdf if cum = TRUE. iter = # of intervals used to calculate the integral (default 1000).
Simulation
Example 1: Use simulation to estimate the probability that the range w = x(8) – x(1) is less than or equal to 20 for a sample of size 8 taken from a Laplace distribution with parameters mu = 10 and beta = 5.
The simulation is conducted as shown in range B2:I1001 of Figure 1 (only the first 12 iterations are displayed).
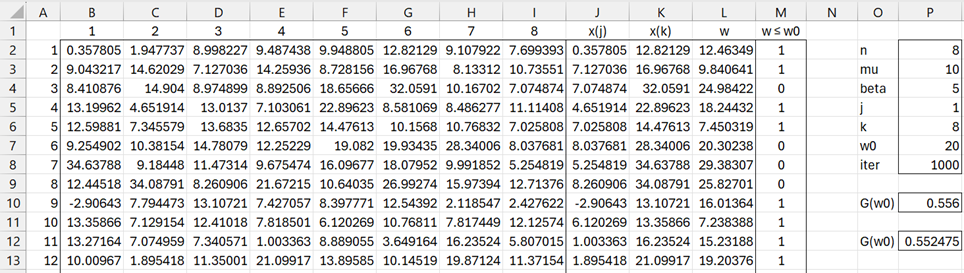
Figure 1 – Simulation for range statistic cdf
For each row, we calculate the x(j) and x(k) order statistics (columns J and K) and the range (column L). We then count the number of simulations that result in a range statistic ≤ 20 and divide this number by the number of iterations to obtain the result shown in cell P10, namely .556.
Here, every cell in the range B2:I1001 contains the formula =LAPLACE_INV(RAND(),10,5). Cells J2 and K2 contain the formulas =SMALL(B2:I2,1) and =SMALL(B2:I2,8), cell L2 contains the formula =K2-J2 and cell M2 contains the formula =IF(L2<=20,1,0). Finally, cell P10 contains the formula =SUM(M2:M1001)/1000 or equivalently =AVERAGE(M2:M1001).
We can also calculate the cdf at w = 20 by using Property 7, as shown in Figure 2.
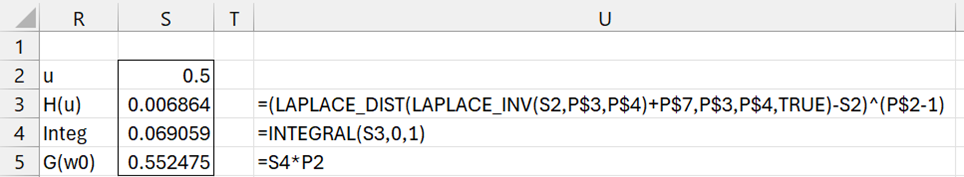
Figure 2 – Range statistic cdf using Property 7
We see that G(20) = .552475 (cell S5), which is close to the simulation estimate of .556 obtained in Figure 1. Finally, the value in cell S5 is the same as the value shown in cell P12 (of Figure 1), as calculated by =RANGE_DIST(P7,P5,P6,P2,TRUE,,”laplace”,P3,P4).
Range Mean
The expected value of the range x(n)–x(1) is the expected value of x(n) minus the expected value of x(1).
Thus, the expected value of the range for a sample of size 11 from a Laplace distribution with μ = 10 and β = 5 is
=ORDER_MEAN(11,11,,”laplace”,10,5)-ORDER_MEAN(1,11,,”laplace”,10,5)
which has the value 21.43666 – (-1.50999) = 22.94665.
Examples Workbook
Click here to download the Excel workbook with the examples described on this webpage.
References
Chen, P-N (2008) Basic theories on order statistics
Reference is no longer available
Ma D. (2010) The distribution of the order statistics. A Blog on probability and statistics
https://probabilityandstats.wordpress.com/2010/02/20/the-distributions-of-the-order-statistics/