Sample Median Theorem
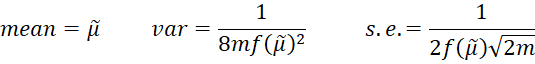
Suppose that we have a sample of size n = 2m + 1 from a population with a continuous distribution whose pdf is f(x). Furthermore, suppose that f(x) ≠ 0 for x = the population median. For n sufficiently large, the sampling distribution of the median (denoted μ-tilde) is approximately normal with
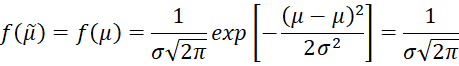
Note too that the pdf of the median is
![]()
Observations
Since the median has a normal distribution N(μ, σ2), it follows that μ is the median and
Thus
From the Central Limit Theorem, when n is sufficiently large, the sample mean is approximately normally distributed with mean μ and
![]()
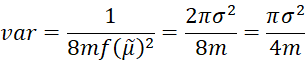
from which it follows that
![]()
Note that as m → ∞
![]()
For example, for n = 25
![]()
This means that the standard error of the median is 1.279 times the standard error of the mean (1.2533 in the limiting case). Therefore, for symmetric distributions, the sample mean is a more efficient estimate of the population mean than the sample median (i.e. it has a smaller variance and so a tighter confidence interval).
The Sample Median Theorem is a good substitute, however, when the Central Limit Theorem doesn’t hold. E.g. the Cauchy distribution doesn’t have a mean, but it does have a median, and so the Sample Median Theorem could be used.
Also, the Sample Median Theorem can be used to find a confidence interval for the median for a non-symmetric distribution.
Examples
Example 1: Repeat Example 1 of Order Statistics Simulation using the Sample Median Theorem.
The analysis is shown in Figure 1.

Figure 1 – Sample median estimate
Note that the theorem only applies to a median for a sample of an odd size. We take the liberty of applying the theorem even when the sample size is even with a small adjustment. If n = 11, then m = 5 and when n = 9, then m = 4. We, therefore, use the value m = 4.5 (halfway between 4 and 5) when n = 10. In general, we set m = n/2 -.5.
The standard error is slightly higher for the result in Figure 1 compared to that in Figure 1 of Order Statistics Simulation. Similarly, the confidence interval is slightly wider.
Worksheet Function
Real Statistics Function: The Real Statistics Resource Pack provides the following array function. This function refers to a distribution dist (“uniform”, “normal”, etc.) with the specified parameters as described for the MEAN_DIST and VAR_DIST functions (see Distribution Property Functions).
MEDIAN_CI(n, lab, alpha, dist, param1, param2, param3): returns a column array with estimates of the population median, standard error of median, and 1–alpha confidence interval based on a sample of size n for the specified continuous distribution.
If lab = TRUE (default FALSE), then a column of labels is appended to the output. The default for alpha is .05.
Note that the formula =MEDIAN_CI(U4,TRUE,,”gamma”,U2, U3) produces output similar to that shown in range T10:U13 of Figure 1.
Examples Workbook
Click here to download the Excel workbook with the examples described on this webpage.
Reference
Miller, S. J. (2015) The probability lifesaver: order statistics and the median theorem
https://web.williams.edu/Mathematics/sjmiller/public_html/probabilitylifesaver/supplementalchap_mediantheoremandorderstatistics.pdf
In Figure 1 – Sample median estimate what is the value and formula of R13?
Hello Ju,
This formula was incorrectly specified. I have updated Figure 1 with the correct formula.
Also, note that you can now download the spreadsheet shown in Figure 1.
Charles