On this webpage, we extend the results shown on Confidence Intervals for Order Statistics, Medians and Percentiles to quartiles and percentiles.
Quartile Example
Example 1: Estimate the 3rd population quartile and its 95% confidence interval based on the sample from Example 1 of Confidence Intervals for Order Statistics, Medians and Percentiles. (repeated on the left side of Figure 1).
We use the same approach as for Example 1 of Confidence Intervals for Order Statistics, Medians and Percentiles, except that this time we estimate the 3rd population quartile by the 3rd sample quartile, which is 29.37 (cell E9 in Figure 1) as calculated in Excel by the formula =QUARTILE.EXC(B3:F9,3). The 3rd quartile is the same as the 75th percentile (3/4 = 75%), and so 29.37 is the 27th order statistic where 27 in cell F16 is calculated by the formula =INT((COUNT(B3:F9)+1)*0.75). Note too that we can also calculate the 3rd quartile by the formula =PERCENTILE.EXC(B3:F9,.75).
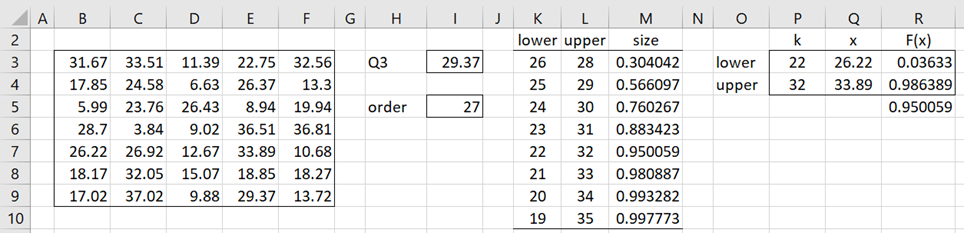
Figure 1 – Confidence interval for the 3rd quartile
We see that the desired confidence interval is (x22, x32) which is slightly larger than a 95% confidence interval. The size of this confidence interval is again calculated using Property 1 of Confidence Intervals for Order Statistics, Medians and Percentiles, this time with p = .75. In particular, the formula in cell M7 is
=BINOM.DIST(L7-1,35,0.75,TRUE)-BINOM.DIST(K7-1,35,0.75,TRUE)
The interval (x22, x32) is (26.22, 33.89) based on the sample data (as shown in Figure 1).
Percentile Example
Note that the 60% percentile of the sample in Figure 1 is 25.564 as calculated by the formula =PERCENTILE.EXC(B3:F9,.6). This value is between the 24.58 and 26.22 sample values. Alternatively, we can calculate this value as follows.
First, note that since n = 35, we calculate k = (35+1)*.6 = 21.6, which requires interpolation between the 21st order statistic, 24.58, and the 22nd order statistic 26,22. Thus, the 60% percentile is 24.58 + .6(26.22-24.58) = 25.564.
To find the 95% confidence interval for the 60% percentile, we calculate the “order statistic” as (n+1)p = 36*.6 = 21.6 (as we saw above). This is almost halfway between 21 and 22, and so we can use the approach described in Confidence Intervals for Order Statistics, Medians and Percentiles for a median from a sample of even size. The result is shown in Figure 2.
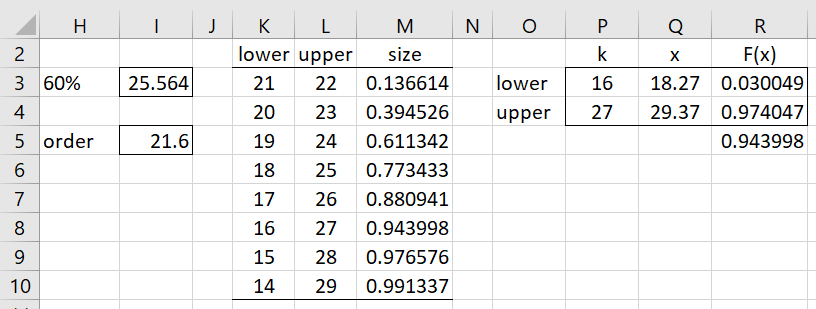
Figure 2 – Confidence interval for 60% percentile
We see from the figure that the closest interval to 95% is as described on the right side of the figure, namely a 94.40% confidence interval.
Note too that since the “order statistic” of 21.6 is not exactly halfway between 21 and 22, the confidence interval is not completely symmetric. If we are willing to accept interpolation, we can calculate a symmetric 95% confidence interval as described in Normal Confidence Intervals for Percentiles.
Examples Workbook
Click here to download the Excel workbook with the examples described on this webpage.
References
Penn State University (2021) Distribution free confidence intervals for percentiles
https://online.stat.psu.edu/stat415/lesson/19