We now turn our attention to estimating confidence intervals for order statistics, medians, and percentile. On this webpage, we focus on one approach for estimating the confidence interval for order statistics and the median. On the following web pages, we explore the following related topics:
- Confidence intervals for percentiles
- Confidence intervals using a normal approximation
- Using simulation to estimate confidence intervals
- Using bootstrapping to estimate confidence intervals
- Sample median theorem
Key Property
Property 1: Suppose that we take a random sample {x1, …, xn} of size n from a population with a continuous distribution. Suppose too that u is the pth percentile in the population and x1 < x2 < … < xn. Then
Proof: Let v = the number of elements in the sample < u. For any element in the population chosen at random, the probability that this element is less than u is p. Thus we can view v as a random variable that has a binomial distribution B(n,p). Thus

Observation: By Property 1, in Excel
![]()
For versions of Excel starting with Excel 2016, we also have
![]()
Examples
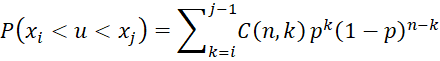
Example 1: Estimate the population median based on the sample shown in range B3:F9 of Figure 1. Also, estimate the 95% confidence interval for the population median.
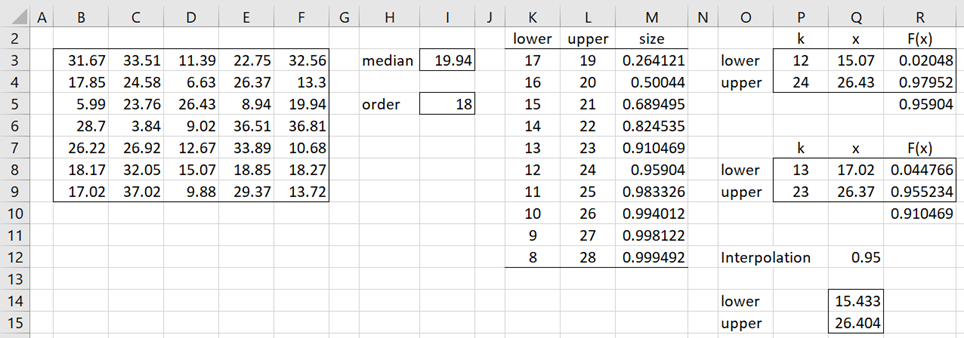
Figure 1 – Confidence Interval for the Median
Using the formula =MEDIAN(B3:F9) we see that 19.94 is the median of the sample. We can use this value as an estimate for the population median. Since the sample contains 35 elements, the median is the 18th order statistic x18 in the sample, where 18 is calculated by the formula =INT((COUNT(B3:F9)+1)/2).
We now look at the sizes of the confidence intervals around the median. We start by looking at the interval (x17, x19), one unit on either side of the median at x18. By Property 1, the size of this interval (cell M3) is .264121 as calculated by the formula
=BINOM.DIST(L3-1,35,0.5,TRUE)-BINOM.DIST(K3-1,35,0.5,TRUE)
In a similar fashion, we calculate the size of intervals 2, 3, etc. units from the median as shown in column M. We see the interval (x12, x24) yields the confidence interval closest to 95% at 95.5904% (cell M8). Now we need to find the 12th and 24th order statistics from the sample. We find that the 95.5904% confidence interval is (15.07, 26.43).
Here, 15.07 is calculated by the formula =SMALL($B$3:$F$9,I3) in cell J3. Similarly, 26.43 is calculated by the formula =SMALL($B$3:$F$9,I4) in cells J4.
We could interpolate between the 95.59% interval (x12, x24) and the 91.05% interval (x13, x23) to obtain an approximate 95% confidence interval (15.433, 26.404), as shown in range Q14:Q15. This is based on linear interpolation. E.g. cell Q14 contains the formula =Interpolate(Q12,R10,R5,Q8,Q3,0).
Even Sample Size
If the sample size n is odd, then the median is x(n+1)/2. If the sample size is even, then the median is the average of xn/2 and xn/2+1 and the approach used to calculate a confidence interval for the median is similar to that described for Example 1 (where the sample size is odd), except that now the various intervals start with (xn/2, xn/2+1). E.g. for a sample of size n = 34, the median is 17.5 and the various confidence intervals are shown in Figure 2.
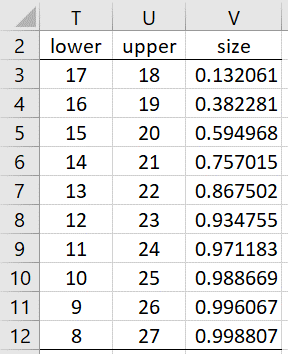
Figure 2 – Confidence Intervals when n is even
We see that the 93.4755% confidence interval (x12, x23) is the one that is closest to 95%. If we require a confidence interval of at least 95%, then we would choose the (x11, x24) interval.
Worksheet Functions
Real Statistics Function: The Real Statistics Resource pack supports the following array function
ORDER_CI(k, n, lab, alpha): returns a column array that estimates the 1-alpha confidence interval around the kth order statistic for samples of size n using a binomial distribution approach.
Three such confidence intervals are specified: the interval that is at least as big as 1-alpha, the next smaller interval, and an exact 1-alpha confidence interval that interpolates between these two.
If k = 0 (default) then the output estimates the median instead of the kth order statistic. If lab = TRUE (default FALSE), then a column of labels is appended to the output. The default for alpha is .05.
The results for Example 1 can be obtained using the formula =ORDER_CI(0,35,TRUE) whose output is displayed in Figure 3.
Figure 3 – ORDER_CI function
Examples Workbook
Click here to download the Excel workbook with the examples described on this webpage.
Reference
Penn State University (2021) Distribution free confidence intervals for percentiles
https://online.stat.psu.edu/stat415/lesson/19
Hello, Charles!
Where I can download the examples (spreadsheet) describes in this topic?
Thank you!
Hello Andrei,
This should have been included in the Distributions examples workbook, but apparently it was omitted.
In any case, I have added a link to the examples workbook to this webpage.
Shortly, I will add links to the other examples for Order Statistics.
Thank for bringing this issue to my attention.
Charles
This is great. Thanks for the explanation.
I think there is one typo. In the following, should x21 be x19?
“We now look at the sizes of the confidence intervals around the median. We start by looking at the interval (x17, x21), one unit on either side of the median at x18.”
Hi Kevin,
Yes. Thank you for finding this error. I have just corrected it on the webpage.
I appreciate your help in improving the accuracy and useability of the website.
Charles