When sample sizes are unequal, the Tukey HSD test can be modified by replacing with
in the above formulas. In particular, the standard error for the q statistic becomes
Note that the Real Statistics Tukey HSD data analysis tool described in Tukey HSD actually performs the Tukey-Kramer Test when the sample sizes are unequal.
Example
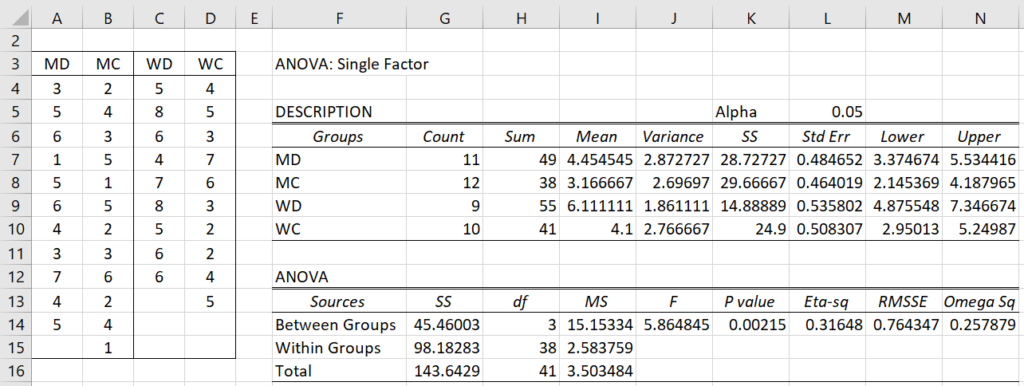
Example 1: Analyze the data in range A3:D15 of Figure 1 using the Tukey-Kramer test to compare the population means of women taking the drug and the control group taking the placebo. This example is the same as Example 1 of Tukey HSD but with some data missing, and so there are unequal sample sizes.
Figure 1 – Data and ANOVA for Example 1
The ANOVA report shown on the right side of Figure 1 shows there is a significant difference between the groups. Since the sample sizes are unequal, we use the Tukey-Kramer test to determine which pairwise comparisons are significant.
Data Analysis Tool
Press Ctrl-m, select the Analysis of Variance option (or the Anova tab if using the Multipage interface), and choose the Single Factor Anova option. A dialog box similar to that shown in Figure 1 of ANOVA Data Analysis Tool now appears. Enter A3:D15 in the Input Range, check Column headings included with data, select the Tukey HSD option, and click on the OK button.
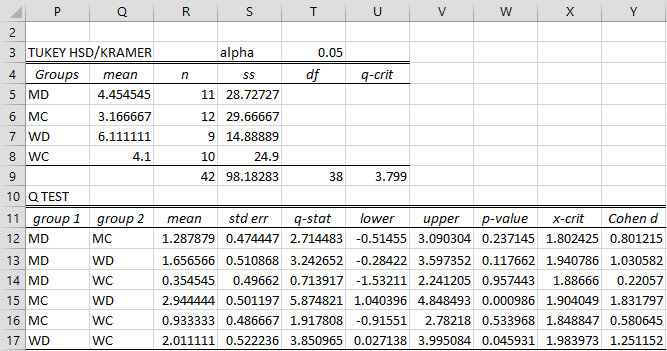
The output is shown in Figure 2.
Figure 2 – Tukey-Kramer Data Analysis
The only significant comparisons are MC-WD and WD-WC.
Examples Workbook
Click here to download the Excel workbook with the examples described on this webpage.
Reference
Howell, D. C. (2010) Statistical methods for psychology (7th ed.). Wadsworth, Cengage Learning.
https://labs.la.utexas.edu/gilden/files/2016/05/Statistics-Text.pdf


