Basic Concepts
The Ryan, Einot, Gabriel, Welsh Studentized Range Q (REGWQ) test uses what is known as a step-down approach to control familywise error. In this test, no confidence intervals are calculated.
To conduct the REGWQ test, first, we arrange the sample means in descending order x̄1 ≥ x̄2 ≥ … ≥ x̄k. We next test whether there is a statistically significant difference between x̄1 and x̄k. If not, then we conclude that all the group means are equal and terminate the testing. If, instead, we find that there is a significant difference between x̄1 and x̄k, then we next test (1) whether there is a significant difference between x̄1 and x̄k-1 and (2) whether there is a significant difference between x̄2 and x̄k.
The process is recursive. At each stage, when we compare x̄i and x̄j (with x̄i ≥ x̄j), we define
![]()
where p = j – i + 1. The null hypothesis that x̄i = x̄j (and therefore all the means x̄i, x̄i+1, … x̄j are equal) is rejected if
![]()
This process is the same as for Tukey’s HSD test except that p and αp are used in calculating qcrit instead of k and α.
If the test shows that there is no significant difference between x̄i and x̄j (or if j = i + 1), then this part of the process terminates; otherwise, we test (1) whether there is a significant difference between x̄i and x̄j-1 and (2) whether there is a significant difference between x̄i+1 and x̄j.
Example
Example 1: Apply the REGWQ to the scenario described in Example 1 of Tukey-Kramer Test, but based on the data on the left side of Figure 1.
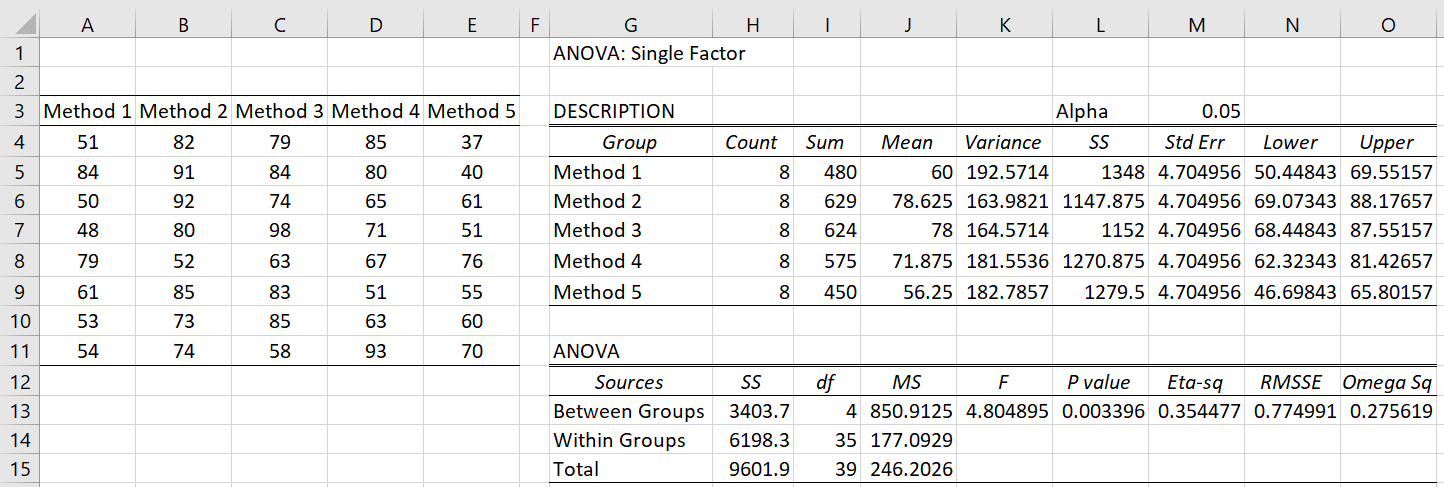
Figure 1 – Comparing five teaching methods
Based on the one-way ANOVA shown on the right side of the figure, we see there is a significant difference between the five teaching methods. We now use the REGWQ post-hoc test, as shown in Figure 2, to pinpoint which pairs of methods are significantly different.
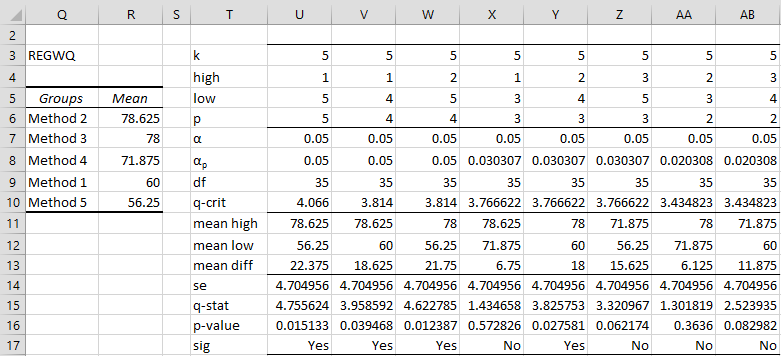
Figure 2 – REGWQ test
The table on the left-hand side of the figure consists of the groups sorted from highest to lowest mean. We will refer to the index (i.e. rank) of these groups, where i = 1 refers to the group with the highest mean (i.e. Method 2) and i = 5 refers to the group with the lowest mean (i.e. Method 5).
Column U refers to the initial test comparing the groups with the highest and lowest means. Since p = 5 – 1 + 1 = 5 (cell U6) and p = 5 > 4 = k – 1, it follows that αp = α = .05 (cell U8). Thus qcrit =QCRIT(U6,U9,U8,2) = QCRIT(p,df,αp,2) = QCRIT(5,35,.05,2) = 4.066. QCRIT is based on the Studentized Range q table of critical values (using interpolation where necessary). We could have used the formula =QINV(U8,U6,U9) instead to get the value 4.0659.
Significance results
The standard error (cell U14) is calculated by the formula =SQRT($J$14/$H$5) and the q-stat (cell U15) by the formula =SQRT($J$14/$H$5). Since q = 4.7556 > 4.066 = qcrit, we conclude that 22.375 (cell U13) is a significant difference between the means of Method 2 and 5.
We calculate the p-value using the formula =QDIST(U15,U6,U9). Since p-value = .01533 < .05 = αp, we again conclude that there is a significant difference between Method 2 and 5. This time we could have used the formula =QPROB(U15,U6,U9) to calculate the p-value obtaining a similar value of .015025.
Since we obtained a significant result, we now proceed on to testing group 1 with group 4 and group 2 with group 5. These comparisons are shown in columns V and W, respectively. Since both of these are significant results we proceed to further testing. Based on the significant result in column V we next test group 1 with group 3 (column X) and group 2 with group 4 (column Y), and based on the significant result in column W we test group 2 with group 4 (column Z) and group 3 with group 5 (column AA).
Of these four tests, only the test in column Y is significant (groups 2 and 4). Thus we continue by testing group 2 with 3 (column AA again) and group 3 with 4 (column AB). Since neither of these yields a significant result, the testing stops.
We conclude there are four significant results: Method 2 with Method 5, Method 2 with Method 1, Method 3 with Method 5, and Method 3 with Method 1.
Data Analysis Tool
We can perform the same test using the Single Factor ANOVA tool. When the dialog box shown in Figure 1 of ANOVA Analysis Tool appears, fill in the Input Range with A3:E11, make sure that the Column headings included with data is checked, and choose the REGWQ option. After clicking on the OK button, the output shown in Figure 3 is displayed.
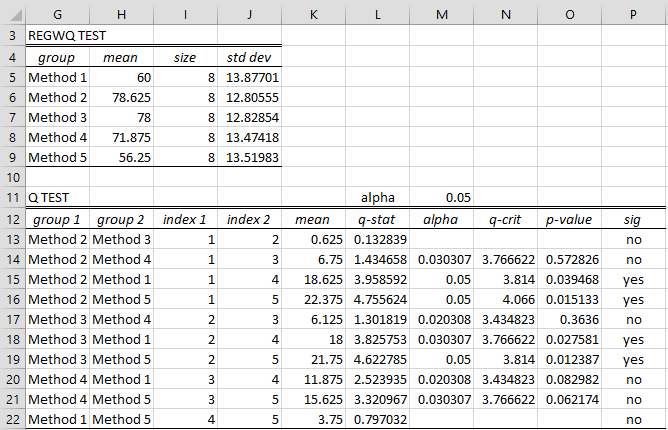
Figure 3 – REGWQ data analysis
We see from the figure that the same four comparisons are significant. We also see that there are no alpha (i.e. αp), q-crit, and p-value entries for the first and last comparisons. This is because these comparisons represent subsets of comparisons that have already been found to be non-significant.
Worksheet Function
Real Statistics Function: The Real Statistics Resource Pack uses the following array function to create the output for the REGWQ option of the Single Factor ANOVA data analysis tool.
REGWQ(R1, lab, alpha): outputs the results of the REGWQ test on the data in R1, including column headings; if lab = TRUE (default FALSE), then column headings are added to the output; alpha is the significance level (default .05).
For Example 1, =REGWQ(A4:E11,TRUE) yields the results shown in range G12:P22 of Figure 3.
Examples Workbook
Click here to download the Excel workbook with the examples described on this webpage.
Reference
Howell, D. C. (2010) Statistical methods for psychology (7th ed.). Wadsworth, Cengage Learning.
https://labs.la.utexas.edu/gilden/files/2016/05/Statistics-Text.pdf