Premise
ANOVA is actually a form of regression. As a result, we can speak about residuals, i.e. the difference between actual data and the values predicted by the regression model. For our purposes, we don’t need to go into the details here. For those who are interested, see ANOVA using Regression.
What is important is to recognize that the normality assumption for ANOVA is that these residuals be normally distributed. As a result, you need to understand how to identify these residuals. Once this is done, we can apply any of the various tests for normality, especially QQ-plots, Shapiro-Wilk test, d’Agostino-Pearson test, etc.
Residuals for One-way ANOVA
For one-way ANOVA, the residuals turn out to be the difference between the actual data elements and their group mean.
Example
Example 1: Identify the residuals for Example 3 of Basic Concepts for ANOVA and determine whether the normality assumption is met. The data for this example is repeated in range A3:D11 of Figure 1.
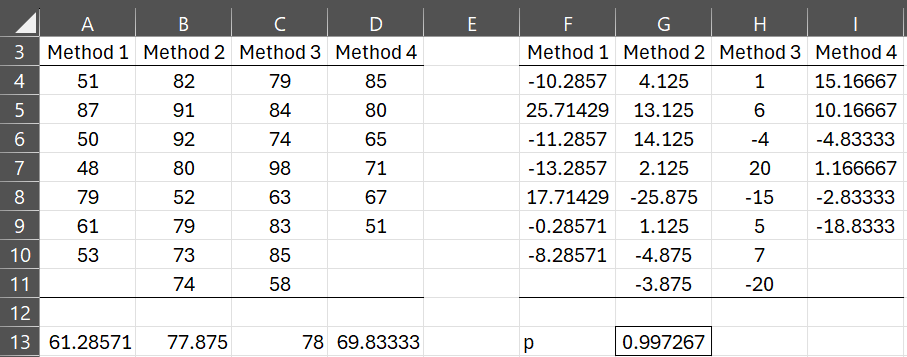
Figure 1 – Testing Normality for ANOVA
The means of the four groups are displayed in range A13:D13. E.g. cell A13 contains the formula =AVERAGE(A4:A11). The residual values xij – mj where mj is the mean of the jth group are displayed on the right side of the figure. This is done by inserting the formula =A4-A$13 in cell F4, highlighting range F4:I11, and pressing Ctrl-R and Ctrl-D.
Finally, you obtain the p-value of the Shapiro-Wilk test by inserting the formula =SWTEST(F4:I11,TRUE) in cell G13. Since p-value = .997267 > .05 = alpha, we conclude there is a very high probability that the residuals are normally distributed.
Worksheet Functions
Real Statistics Functions: The Real Statistics Resource Pack provides the following worksheet functions
Anova1Res(R1): returns a column array with the residuals for one-way ANOVA on the data in R1 in standard (stacked) format (i.e. two column array with labels in the first column and numeric values in the second column).
Anova1ResX(R1): returns a column array with the residuals for one-way ANOVA on the data in R1 in Excel format (i.e. array with one column per group).
Thus, =Anova1ResX(R1) is equivalent to the array formula =Anova1Res(Anova1Std(R1)).
We can use the Anova1ResX to obtain the result for Example 1, as shown in Figure 2.
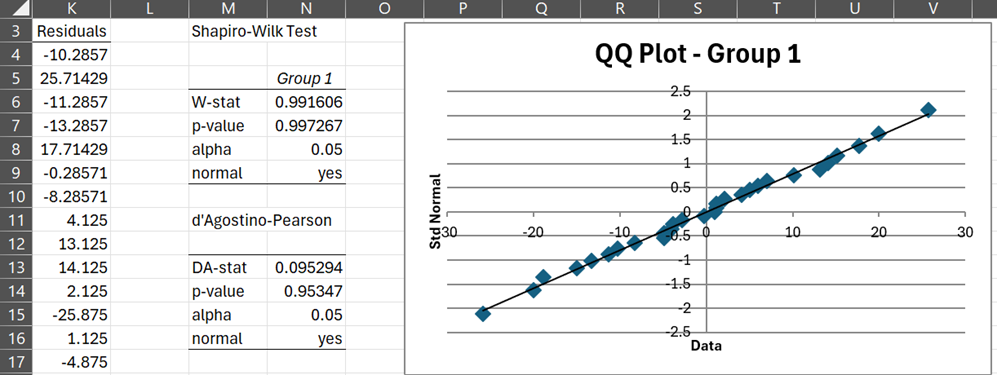
Figure 2 – Testing normality using Anova1ResX
Here we used the formula =Anova1ResX(A4:D11) to obtain the residuals in range K4:K32 (rows 18 to 32 are not displayed). We then used the Descriptive Statistics and Normality data analysis tool on Input Range K4:K32 to obtain the normality test results and QQ plot shown in Figure 2.
Once again, we conclude that the normality assumption for one-way ANOVA has been met.
Normality of each group
Many sources will state the normality assumption for one-way ANOVA as “each group is normally distributed”. While this is often implies that the residuals are normally distributed, it is not always so.
Figure 3 shows an example where the normality assumption is met (i.e. residuals are normally distributed), but one of the three groups is not normally distributed.
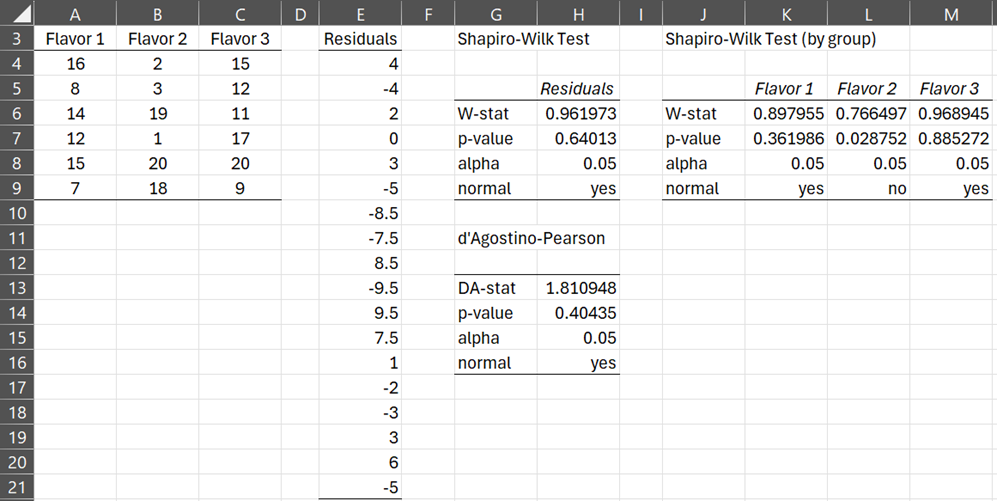
Figure 3 – Counter-example 1
In Figure 4, we show an example where the normality assumption is not met (i.e. residuals are not normally distributed), but all the groups are normally distributed.
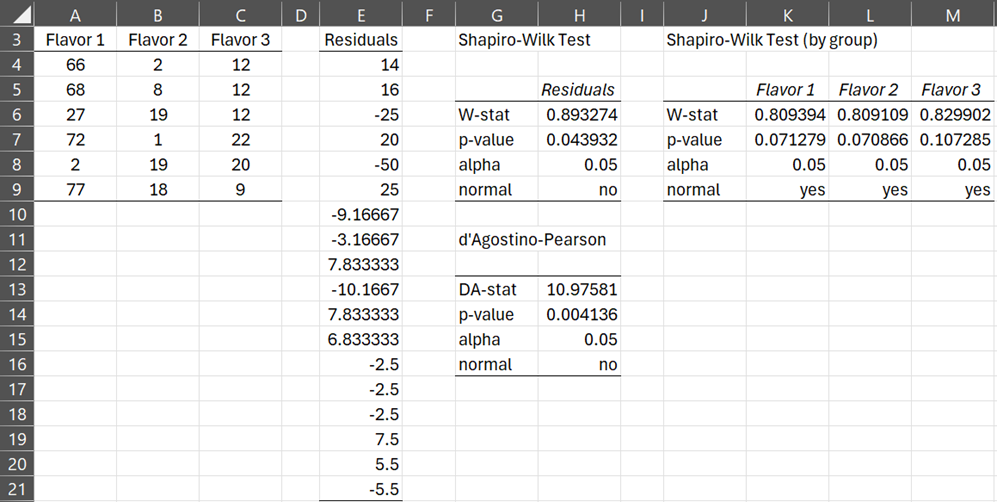
Figure 4 – Counter-example 2
Examples Workbook
Click here to download the Excel workbook with the examples described on this webpage.
References
GraphPad (2024) Residuals tab: One-way ANOVA
https://www.graphpad.com/guides/prism/latest/statistics/stat_1wayanova_residuals-tab.htm
Minitab (2024) Does the response need to follow a normal distribution?
https://support.minitab.com/en-us/minitab/help-and-how-to/statistical-modeling/anova/supporting-topics/anova-models/does-the-response-need-to-be-normal/#:~:text=ANOVA%20assumes%20that%20the%20residuals,assumptions%20of%20ANOVA%20are%20met.
Dear Prof. Zaiontz,
I am having some difficulty applying these formulas with my class. Some students do not appear to have access to the Anova1ResX and Anova1Res formulas, even though they have downloaded the latest version of RealStat and use Microsoft 365.
Is there an alternative formula that still works? Of course, an alternative would be to calculate the mean for each group and then subtract the observed values from these means, but an automatic formula would certainly be more efficient!
Thank you very much,
Simone
Hello Simone,
Can you please provide the following information about the students who don’t have access to the Anova1ResX and Anova1Res functions so that I can best respond to your comment?
1. Are they using the Mac or Windows?
2. What do they see when they insert the formula =VER() in any cell?
Charles
Hello,
The students do use Windows and they can apply the formula =VER()
Thanks!!
Simone
…and when they apply the formula, the result is 7.9.1 Excel 2010/2013/2016/2019 Windows
Hello Simone,
This is a release from more than 4 years ago. I suggest that they upgrade to the latest release or wait a few more days to get the next release, Rel 9.7.
Charles