In Independence Testing, we describe how to perform testing for contingency tables where both factors are nominal. In Ordered Chi-square Testing for Independence, we describe how to perform similar testing when both factors are ordinal. On this webpage, we consider the case where one factor is nominal and the other is ordinal.
Example
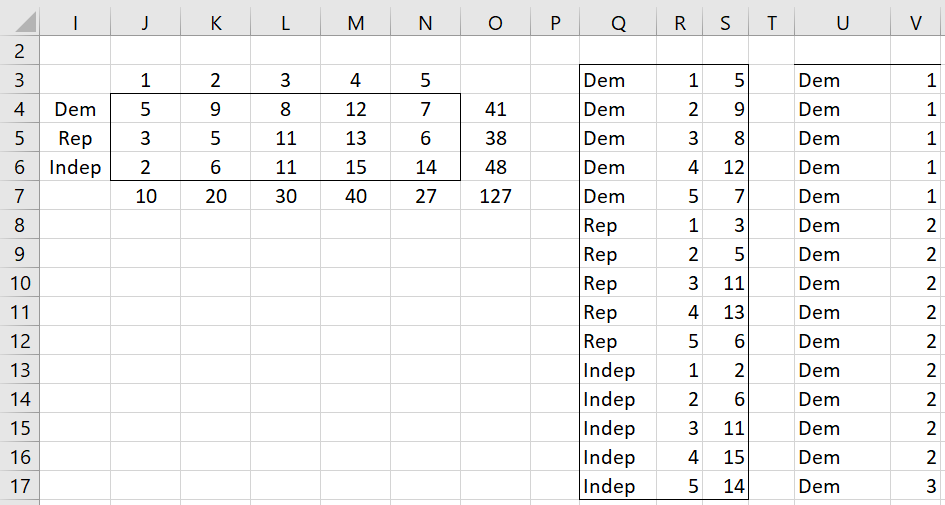
Example 1: 127 people who attended a training course were asked to rate their satisfaction with the economy as very dissatisfied, dissatisfied, neutral, satisfied and very satisfied. We would like to know whether their level of satisfaction is independent of their political party category (Democrat, Republican, Independent) based on the contingency table shown in Figure 1.
Figure 1 – Nominal-ordinal contingency table
Here, the row factor is nominal and the column factor is ordinal. If we also assume that the column factor has a Likert scale, then the contingency table can be represented as shown on the left side of Figure 2.
Figure 2 – Reformatting for Kruskal-Wallis
We can use Kruskal-Wallis to test whether the median satisfaction values of the three political parties are significantly different. To do this, we must first reorganize the data.
We first insert the array formula =Anova2Std(I3:N6) in range Q3:S17 and then the array formula =FREQ2RAW(Q3:S17) in range U3:V114 (only the first 15 of 127 rows are displayed). This latter range represents the data in standard format required for the Kruskal-Wallis test. Using the One-Factor ANOVA data analysis tool, we obtain the results of the Kruskal-Wallis test as shown in Figure 3.
Figure 3 – Kruskal-Wallis Test
Columns X, Y and Z show the data in U and V reformatted Excel format for ANOVA. We see that p-value = .145, and so there is no statistical difference between the parties regarding their satisfaction with the economy. If a significant result had been detected, then follow-up testing could be done using the One-Factor ANOVA data analysis tool.
Real Statistics Support
Click here for Real Statistics Support for Nominal-Ordinal Independence Test.
Examples Workbook
Click here to download the Excel workbook with the examples described on this webpage.
References
Howell, D. C. (2001) Chi-square with ordinal data
https://www.uvm.edu/~statdhtx/StatPages/More_Stuff/OrdinalChisq/OrdinalChiSq.html
Agresti, A. (1996) An introduction to categorical data analysis. New York: Wiley.
Agresti, A. (1981) Measures of nominal-ordinal association
https://users.stat.ufl.edu/~aa/articles/agresti_1981.pdf
Beh, E. J. (2008) Simple correspondence analysis of nominal-ordinal contingency tables
https://www.researchgate.net/publication/26501604_Simple_Correspondence_Analysis_of_Nominal-Ordinal_Contingency_Tables
Starkweather, J. (2020) Nominal and ordinal variable analysis
http://bayes.acs.unt.edu:8083/BayesContent/class/Jon/ISSS_SC/Module011/isss_m11_nomord/


Dear Zaiontz,
I got a data table in which there are 2 rows (number of positive & negative cases) and 4 columns of groups (including control). The total sum of the numbers of positive & negative cases for each group is 16; in two of the groups I got zero positive cases, and in other two groups I got 3 and 7 positives out of 16 cases.
1.Should I include the number of negative cases (16 minus positives) in a row in the table?
2.Which statistical test would you recommend to comprehend if there is a significant difference between groups?
3.If chi-square is recommended, which type of chi test would match more decently?
Sincerely,
Nafis