Basic Concepts
Contrasts can be used after a Kruskal-Wallis test as for one-way ANOVA. A contrast C is defined based on the contrast coefficients by
where
Taking ties into account the formula for the standard error becomes
The square of the contrast C2 is then tested using a chi-square distribution with k−1 degrees of freedom.
Data Analysis Tool
Example 1: Determine whether there is a significant difference between the Control and the average of the New and Old groups for the data in Example 1 of Kruskal-Wallis Test.
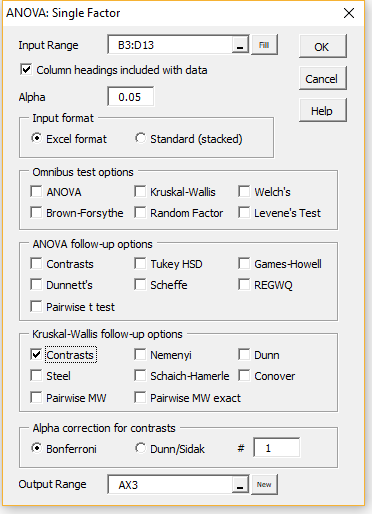
To perform this test, press Ctrl-m and double-click on Analysis of Variance (or click on the Anova tab if using the Multipage interface) and select Single Factor Anova. Fill in the dialog box that appears as shown in Figure 1.
Since we plan to perform only one contrast test, we keep the default of 1 in the Alpha correction for contrasts. If instead, we planned to perform 2 contrast tests we would change 1 to 2, and we would select whether we want to use a Bonferroni (default) or Dunn-Sidàk correction. If the default option were picked then the significant level for each of the two tests would be reduced from .05 (the selected Alpha value) to .05/2 = .025.

Figure 1 – Contrasts-KW option
Results
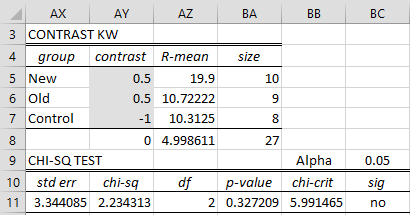
When we press the OK button the result shown in Figure 2 is displayed where the contrast values are blank. We next fill in the contrast coefficients as shown in range AY5:AY7, making sure that the sum of these values is zero (as shown in cell AY8). As shown in cell BC11, this test is not significant.

Figure 2 – Contrasts after KW Test
Note that the standard error (cell AX11) is calculated by the formula
=SQRT((BA8*(BA8+1)-TiesCorrection(B4:D13)/(BA8-1))/12*SUMPRODUCT(AY5:AY7^2,1/BA5:BA7))
The chi-square value (cell AY11) is calculated by =(AZ8/AX11)^2, df (cell AZ11) is calculated by the formula =COUNT(BA5:BA7)-1, p-value (cell BA11) is calculated by the formula =CHISQ.DIST.RT(ABS(AY11),AZ11), and chi-crit (cell BB11) is calculated by the formula =CHISQ.INV.RT(BC9,AZ11).
Examples Workbook
Click here to download the Excel workbook with the examples described on this webpage.
References
Wikipedia (2018) Contrasts (statistics)
https://en.wikipedia.org/wiki/Contrast_(statistics)#:~:text=In%20statistics%2C%20particularly%20in%20analysis,allowing%20comparison%20of%20different%20treatments.
Zar. J. H. (2010) Biostatistical analysis 5th Ed. Pearson

