Basic Concepts
Moses’ test for equal variability is a nonparametric test to determine whether two samples come from populations with equal variances. It is similar to the Siegel-Tukey test except that it does not require any assumption about the medians. The assumptions for this test are
- The two (random) samples are independent
- The data is at least interval, and the dependent variable is continuous
- The two populations have the same shape
Test Description
The steps in the test are as follows:
- Divide each sample randomly into (at least two) subsamples, each of the same size k. Any data that is left over is discarded. k must be larger than 1.
- For each subsample R1, calculate =DEVSQ(R1).
- For each of the two samples, create a new sample consisting of these =DEVSQ(R1) values.
- Apply the Mann-Whitney test using these new samples
Clearly, there are choices as to the value of k. Generally, you want k to take a value between 2 and 10. The higher value for k, the better, but you want to make sure that the size of the revised samples will yield meaningful results when the MW test is applied. Also, all things being equal, you want to limit the number of unused sample elements.
Cautions
Generally, Moses’ test has lower power than Siegel-Tukey (which has lower power than the F-test when the samples are normally distributed). Also, the random allocation of the data into subsamples can be highly relevant to the results obtained (some producing significant results and others not). In any case, you should not apply Moses’ test multiple times until you get a result that you like.
Example
Example 1: Apply Moses’ test for the data in columns A and B of Figure 1.
The analysis is shown in the rest of Figure 1. First, insert the array formula =SHUFFLE(A2:A13) into range D2:D13 and =SHUFFLE(B2:B13) into range E2:E13. Next, insert the formula =DEVSQ(D2:D4) into cell G2, and then copy this formula into cells, G5, G8, G11, H2, H5, H8, H11, and H14. Finally, insert the array formula =MW_TEST(G2:G11,H2:H14,TRUE) into range J2:K7.
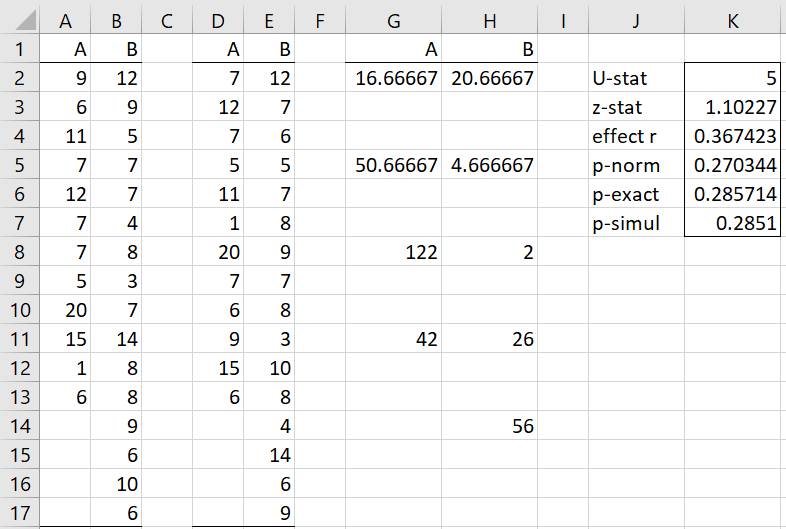
Figure 1 – Moses’ test example
Since we obtain a non-significant result, we can’t conclude that there is a significant difference between the variability of the two populations. Unfortunately, a different shuffling of the data in columns D and E could produce a significant result (as we see below).
Worksheet Function
Real Statistics Function: The Real Statistics Resource Pack provides the following function, which returns output consisting of the U-stat, z-stat, r effect size, and the three types of p-values (the normal approximation, exact test, and simulation), as for the MW_TEST function (see Mann-Whitney Test).
MOSES_TEST(R1, R2, ngrps, lab, tails, ties, cont, exact, iter): returns a column array with the output described above for the samples contained in ranges R1 and R2 based on subsamples of size ngrps.
tails = 1 or 2 (default). For the normal approximation, if ties = TRUE (default), the ties correction factor is applied; if cont = TRUE (default), a continuity correction is applied. If exact = TRUE (default FALSE), then the p-value of the exact test is output; if iter ≠ 0, then the p-value of the simulation version of the test is output, where the simulation consists of iter samples (default 10,000). Finally, if lab = TRUE (default FALSE), then an extra column of labels is appended to the output.
See Mann-Whitney Exact Test and Mann-Whitney Simulation for more information about the exact test and simulation p-values.
When we used the array formula =MOSES_TEST(A2:A13,B2:B18,3,TRUE), we obtained the output shown in Figure 2.
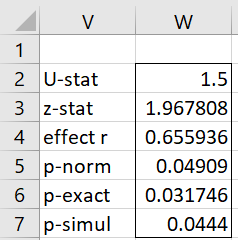
Figure 2 – Moses’ worksheet function output
This time, we obtained a significant result. It is quite possible that using this formula again will produce a very different result.
Examples Workbook
Click here to download the Excel workbook with the examples described on this webpage.
Links
References
Siegel, S., Castellan, N. J. (1988) Nonparametric statistics for the behavioral sciences, 2nd ed.
https://psycnet.apa.org/record/1988-97307-000
Sheskin, D. (2000) Handbook of parametric and nonparametric statistical procedures. 2nd ed. Chapman & Hall/CRC