Basic Concepts
The Mann-Whitney U test is essentially an alternative form of the Wilcoxon Rank-Sum test for independent samples and is completely equivalent.
Define the following test statistics for samples 1 and 2 where n1 is the size of sample 1 and n2 is the size of sample 2, and R1 is the adjusted rank-sum for sample 1 and R2 is the adjusted rank-sum of sample 2. It doesn’t matter which sample is bigger.
![]()
As for the Wilcoxon version of the test, if the observed value of U is < Ucrit then the test is significant (at the α level), i.e. we reject the null hypothesis. The values of Ucrit for α = .05 (two-tailed) are given in the Mann-Whitney Tables.
Example using the table of critical values
Example 1: Repeat Example 1 of the Wilcoxon Rank Sum Test using the Mann-Whitney U test.
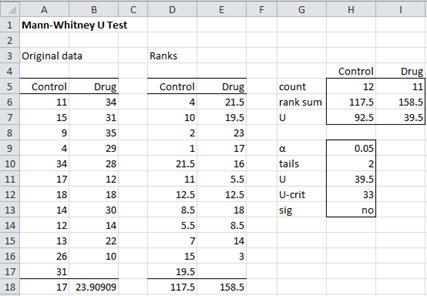
Figure 1 – Mann-Whitney U Test
Since R1 = 117.5 and R2 = 158.5, we can calculate U1 and U2 to get U = 39.5. Next, we look up in the Mann-Whitney Tables for n1 = 12 and n2 = 11 to get Ucrit = 33. Since 33 < 39.5, we cannot reject the null hypothesis at α = .05 level of significance.
Properties
Property 2: For n1 and n2 large enough the U statistic is approximately normal N(μ, σ2) where
Observation: Click here for proofs of Properties 1 and 2.
Property 3: Where there are a number of ties, the following revised version of the variance gives better results:
where n = n1 + n2, t varies over the set of tied ranks and ft is the number of times (i.e. frequency) the rank t appears. An equivalent formula is
 Continuity Correction
A further complication is that it is often desirable to account for the fact that we are approximating a discrete distribution via a continuous one by applying a continuity correction. This is done by using a z-score of
instead of the same formula without the .5 continuity correction factor.
Example using a normal approximation
Example 2: Repeat Example 2 of the Wilcoxon Rank Sum Test using the Mann-Whitney U test.
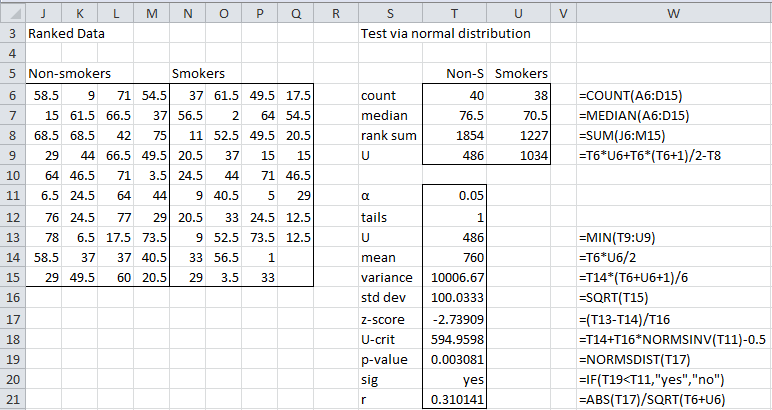
Figure 2 shows the results of the one-tailed test (without using a ties correction). Column W displays the formulas used in column T.
Figure 2 – Mann-Whitney U test using normal approximation
As can be seen in cell T19, the p-value for the one-tail test is the same as that found in Wilcoxon Example 2 using the Wilcoxon rank-sum test. Once again we reject the null hypothesis and conclude that non-smokers live significantly longer.
Effect Size
The effect size for the data using the Mann-Whitney test can be calculated in the same manner as for the Wilcoxon rank-sum test, namely
and the result will be the same, which for Example 2 is r = .31, as shown in cell T21 of Figure 2. This is a medium-sized effect.
Here, .1 is a small effect, .3 is a medium effect, and .5 is considered to be a large effect.
Rank-biserial Correlation
There is another measure of effect size, namely
p represents the probability that a score randomly generated from population A will be bigger than a score randomly generated from population B, where A and B are the populations corresponding to the two samples and A corresponds to the sample with the higher value. The higher this value is the larger the effect.
The difference between p and its complement 1–p provides a standard effect size r called the rank-serial correlation. Thus
where μ is the mean of the normal approximation. For Example 2, the rank-serial correlation is r = 1 – 486/760 = .36, which is a medium-sized effect.
Worksheet Functions
Real Statistics Functions: The Real Statistics Resource Pack provides the following functions:
MANN(R1, R2) = U for the samples contained in R1 and R2
MANN(R1, n) = U for the sample contained in the first n columns of R1 and the sample consisting of the remaining columns in R1. If the second argument is omitted it defaults to 1.
MWTEST(R1, R2, tails, ties, cont) = p-value of the Mann-Whitney U test for the samples contained in R1 and R2 using the normal approximation. tails = 1 or 2 (default). If ties = TRUE (default) the ties correction factor is applied. If cont = TRUE (default) a continuity correction is applied.
Any empty or non-numeric cells in R1 or R2 are ignored.
Observations
For Example 2, we can use the Real Statistics MANN function to arrive at the value of 486 for U shown in cell T9 of Figure 2, namely =MANN(J6:M15,N6:Q15) = 486. Similarly, the p-value of 0.003081 in cell T19 can be calculated by =MWTEST(J6:M15,N6:Q15,1,FALSE,TRUE).
Note that the z-score and the effect size r can be calculated using the Real Statistics function MWTEST as follows:
z-score = NORM.S.INV(MWTEST(R1, R2))
r = NORM.S.INV(MWTEST(R1, R2))/SQRT(COUNT(R1)+COUNT(R2))
The results of analysis for Example 2 can be summarized as follows: The life expectancy of non-smokers (Mdn = 76.5) is significantly higher than that of smokers (Mdn = 70.5), U = 486, z = -2.74, p = .0038 < .05, r = .31, based on a one-tailed test Mann-Whitney test with continuity correction, but no correction for ties.
Of course, you can also use a two-tailed test with a ties correction, as we demonstrate shortly.
Worksheet Array Function
Real Statistics Function: The Real Statistics Resource Pack provides the following function that returns output consisting of the U-stat, z-stat, r effect size, and the three types of p-values (the normal approximation, exact test, and simulation).
MW_TEST(R1, R2, lab, tails, ties, cont, exact, iter): returns a column array with the output described above for the samples contained in R1 and R2. tails = 1 or 2 (default). For the normal approximation, if ties = TRUE (default) the ties correction factor is applied; if cont = TRUE (default) a continuity correction is applied; when exact = TRUE (default FALSE) then the p-value of the exact test is output and if iter ≠ 0 then the p-value of the simulation version of the test is output where the simulation consists of iter samples (default 10,000). If lab = TRUE (default FALSE) then an extra column of labels is appended to the output.
Any empty or non-numeric elements in R1 or R2 are ignored. See Mann-Whitney Exact Test and Mann-Whitney Simulation for more information about the exact test and simulation p-values.
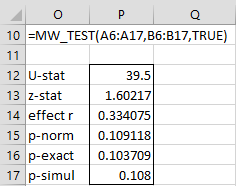
Figure 3 displays the output from =MW_TEST(A6:A17,B6:B17,TRUE) for Example 2.
Figure 3 – Output from MW_TEST
Even if the argument is set to FALSE, the p-value of the exact test will be produced provided both samples have fewer than 800 elements and the smaller sample has at most 300 elements.
Data Analysis Tool
Real Statistics Data Analysis Tool: The Real Statistics Resource Pack also provides a data analysis tool that performs the Mann-Whitney test for independent samples, automatically calculating the medians, rank sums, U test statistic, z-score, p-values, and effect size r.
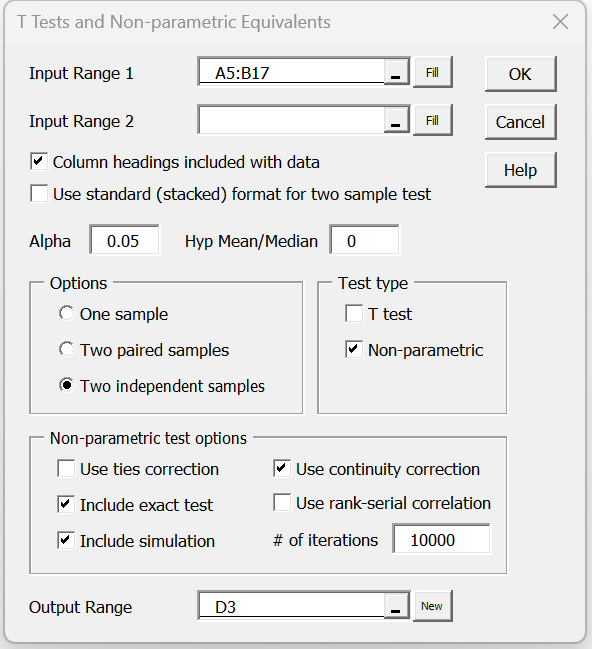
For example, to perform the analysis in Example 1, press Ctrl-m and choose the T Test and Non-parametric Equivalents data analysis tool from the menu that appears (or from the Misc tab if using the Multipage user interface). The dialog box shown in Figure 4 now appears.
Figure 4 – Dialog box for Real Statistics Mann-Whitney Test
Enter A5:B17 as the Input Range 1 (alternatively, insert A5:A17 in Input Range 1 and B5:B17 in Input Range 2), click on Column headings included with data, choose the Two independent samples and Non-parametric options, and click on the OK button. Keep the default of 0 for Hypothetical Mean/Median and .05 for Alpha (although these values are not used) For this version of the test, we check the Use continuity correction, Include exact test, and Include table lookup options, but leave the Use ties correction option unchecked.
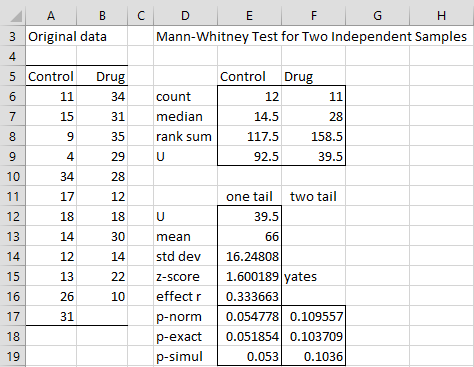
The output is shown in Figure 5.
Figure 5 – Mann-Whitney test data analysis tool output
Note that both the one-tail and two-tail tests are displayed. Also, three versions of the test are shown: the test using the normal approximation (range E17:F17), the test using the exact test (range E18:F18), and the simulation test (range E19:F19). The fact that the “Yates” continuity correction factor is used is noted in cell F15.
Ties correction version
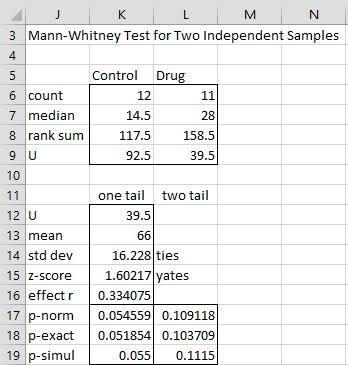
If we check the Use Ties correction option in Figure 4 we would obtain the output shown in Figure 6.
Figure 6 – Mann-Whitney test with ties correction
In this case, the ties correction of Property 3 is applied to the normal approximation. As you can see there is very little difference between the outputs shown in Figures 5 and 6.
Note too that the ties correction (as well as the continuity correction) only applies to the normal approximation. The ties and continuity corrections are not applied to the exact and simulation versions of the test. The difference in the simulation p-values (row 19) in Figures 5 and 6 is due to the randomness of the simulations and not the ties correction.
Rank-serial correlation version
If the Use rank-serial correlation option were checked in Figure 4, then cell K16 in Figure 6 would contain the formula =1-K12/K13 with value .4015. Cell L16 would contain the value “rank-serial”.
Ties correction worksheet function
Real Statistics Function: The Real Statistics Pack provides the following function to calculate the ties correction used in the data analysis tool.
TiesCorrection(R1, R2, type) = ties correction value for the data in R1 and optionally R2, where type = 0: one sample, type = 1: paired sample and type = 2: independent samples
For the Mann-Whitney test type = 2. The ties correction is used in the calculation of the standard deviation (cell U15 of Figure 6) as follows
=SQRT(K13*(K6+L6+1)/6*(1-TiesCorrection(A6:A17,B6:B17,2)/ ((K6+L6)^3-K6-L6)))
Exact Test
Click here for a description of the exact version of the Mann-Whitney Test using the permutation function.
Simulation
Click here for a description of how to use simulation to determine the p-value for the Mann-Whitney test. This approach takes ties into account.
Confidence Interval of the Median
Click here for a description of how to calculate a confidence interval of the median based on the Mann-Whitney Test.
Statistical Power and Sample Size
Click here for a description of how to calculate the statistical power or minimum sample size required for the Mann-Whitney Test.
Examples Workbook
Click here to download the Excel workbook with the examples described on this webpage.
References
Howell, D. C. (2010) Statistical methods for psychology (7th ed.). Wadsworth, Cengage Learning.
https://labs.la.utexas.edu/gilden/files/2016/05/Statistics-Text.pdf
Zar. J. H. (2010) Biostatistical analysis 5th Ed. Pearson
Kerby, D. S. (2014). The simple difference formula: an approach to teaching nonparametric correlation. Comprehensive Psychology.
https://journals.sagepub.com/doi/pdf/10.2466/11.IT.3.1

Hi Charles
I’m running a Mann–Whitney U test to compare user interface usability between those with <5 years and ≥5 years of experience on a total of 35 participants. The output shows p-norm, p-exact, and p-simul. Please may I know which of these p to report in the manuscript and why?
Thank you
Hello Albert,
The values should be similar.
If there aren’t many ties, then p-exact should be best. Otherwise, use the p-norm value.
Charles
Dear Charles,
I’d like to get to know how come you have got the Ucrit = 33 from the hyperlinked table of U-MW values? I think the Mann-Whitney table for n1 = 12 and n2 = 11 should give the Ucrit = 24.
Cheers,
Mariusz from Poland
Hello Mariusz,
Glad to be communicating with you in Poland.
The critical value for alpha of .01 is 24, but for alpha of .05 the critical value is 33.
See https://real-statistics.com/statistics-tables/mann-whitney-table/
Charles
Hello Charles,
First a big thank you for this fabolous web-site.
I am using Excel for non-parametric statistics, like on this site, BUT I think I have found a ‘bug’ in Excel. When I try to rank the numbers, fx -0.2 and -0.2 is not always equal. I found out that Excel is not always correct in calculating; the numbers differ on decimal nr. 15:
Excample:
42,1-43,3=-0,199999999999996
51,3-51,5=-0,200000000000003
Do know any way to solve this problem
Best regards Sander
Hello Sander,
On my computer
42,1-43,3=-0,200000000000000
51,3-51,5=-0,200000000000000
(although the comma is replaced by a period)
In any case, I understand the problem regarding Excel’s ranking function. For this reason, Real Statistics contains the following worksheet function to deal with this problem:
RANK_AVG(x, R1, order, num_digits): returns the same value as the Excel formula =RANK.AVG(x, R1, order) where x and all the values in R1 are first rounded off to num_digits number of decimal places. If num_digits is omitted then 8 decimal places are used.
Charles
Hello Charles,
My students in Marseilles appreciate your macro Real statistics especially the ability to perform non parametric tests.
My students are puzzled with the fact that the macro does not deliver critical values for Mann Whitney test. Would you be so kind as to add critical value from the table.
Cheers
Hello Franck,
I am very pleased to see that your students are using the Real Statistics add-in.
The table of critical values for the Mann Whitney test are derived from the MW Exact test, as described at
https://real-statistics.com/non-parametric-tests/mann-whitney-test/mann-whitney-exact-test/
You can use the worksheet function MWINV to obtain the values in the table.
Charles
Hello Charles,
thank you for your very helpful article. I’ d like to ask you a question.
Can I use the Mann-Whitney U test if the sizes of the samples are very imbalanced (e.g. n1=24, n2=4)?
Thanks again,
Thanasis
Hello Thanasis,
Yes, you can use the Mann-Whitney test in this case. Since n1 = 24 > 20 you can’t use the table of critical values, but the normal approximation requires that n2 = 4 >= 20, which it sisn’t. Probably the normal approaximation will suffice, but better yet, I suggest that you use the exact test. See
https://real-statistics.com/non-parametric-tests/mann-whitney-test/mann-whitney-exact-test/
Charles
Hello, Charles.
Today I tested Real Statistics Data Analysis Tool, release 8.8, T Test and non parametric equivalents, selecting they option non parametric (for obtaining Mann Whitney test results), choosing continuity correction, including exact test and including simulation (10000 iterations). I got an error related to a matrix calculation for p-value simulation (simulation was cut and p-value for simulation was blank). I run Excel 365, Spanish version.
That error is not present when I use an earlier version of Real Statistics (downloaded two years ago, on July 2021): with that version I can obtain values very similar to those obtained by normal p-value and exact p-value.
In suposse there’s a little change in the way matrix calculations are used for obtaining p-value by simulation.
I will be waiting for your comments.
Thanks you.
William Agurto.
Hello William,
I don’t think that I have made any changes to the Mann-Whitney test in the past two years. But as I am sure you know, sometimes some other change has impacted this capability. In any case, can you email me the data that you used so that I can use it to test the Mann Whitney tool?
Charles
Hello, Charles.
Thank you for your answer.
Here’s my data (two independent samples):
Nivel Autoestima, Mujeres Nivel de Autoestima, Varones
34 52
32 52
35 45
41 38
38 45
29 24
43 38
26 46
52 48
41 45
44 31
47 40
33 52
53 39
32 38
41 54
38 35
32 48
38 44
57 53
35 34
29 48
31 49
56 43
36 54
42 53
47 34
28 50
37 53
44 48
42 47
41 57
50 52
44 44
39 54
30 43
37 50
55 56
56 54
29 45
51 54
38 32
51 49
40 57
40 44
33 52
43
38
43
56
47
43
53
As I told you, the problem is present only in the last release (8.8) of Real Statistics. It’s not present in an earlier version (July 8th, 2021). I don’t know if the bug is present in other versions: I detected that in release 8.8.
The text of the error in Excel 365 (Spanish version) is:
“A runtime error has occurred. The analysis tool will be aborted.
No se puede asignar la propiedad FormulaArray de la clase Range”.
Thank you.
William Agurto.
Hello, Charles:
For clarity, I resent the data (in the prior message it’s not clear which column has more data):
Nivel Autoestima, Mujeres (n1=46):
34
32
35
41
38
29
43
26
52
41
44
47
33
53
32
41
38
32
38
57
35
29
31
56
36
42
47
28
37
44
42
41
50
44
39
30
37
55
56
29
51
38
51
40
40
33
Nivel de Autoestima, Varones (n2=53):
52
52
45
38
45
24
38
46
48
45
31
40
52
39
38
54
35
48
44
53
34
48
49
43
54
53
34
50
53
48
47
57
52
44
54
43
50
56
54
45
54
32
49
57
44
52
43
38
43
56
47
43
53
William Agurto.
Thanks William,
Thanks for sending me your data. Yes, there is a bug in the software that was inadvertantly introduced a couple of releases ago.
I have now fixed the bug. I plan to issue a new bug-fix release shortly which will resolve this issue.
Thank you very much for bringing this issue to my attention.
Charles
Hello, Charles.
Today I tested Real Statistics Data Analysis Tools, Release 8.8.1, with the same data, the same parameters (column heading included with data; alpha=0.05; Hyp Mean/Median=0; two independent samples; T-Test and Non Parametric Test; using: ties correction, using continuity correction, including simulation, inscluding exact test) and I got the same error (Excel 365, Spanish version):
“A runtime error has occurred. The analysis tool will be aborted.
No se puede asignar la propiedad FormulaArray de la clase Range”
It seems like the bug is present in a rutine related to “include simulation” process, because it’s not present when I don’t select that option (and it’s present when I select only “include simulation” option).
I will appreciate your comments.
Thanks a lot.
William Agurto.
Note: Here the data:
Nivel Autoestima, Mujeres (n1=46):
34
32
35
41
38
29
43
26
52
41
44
47
33
53
32
41
38
32
38
57
35
29
31
56
36
42
47
28
37
44
42
41
50
44
39
30
37
55
56
29
51
38
51
40
40
33
Nivel de Autoestima, Varones (n2=53):
52
52
45
38
45
24
38
46
48
45
31
40
52
39
38
54
35
48
44
53
34
48
49
43
54
53
34
50
53
48
47
57
52
44
54
43
50
56
54
45
54
32
49
57
44
52
43
38
43
56
47
43
53
William,
Sorry about the persistence of this bug. Apparently, I fixed it in the Mac version of the release but not the Windows version (or the new Xrealstatsx.clam version). I will issue a new release on Sunday to correct this.
Charles
Dear Charles:
I tested the last version of Real Statistics (release 8.8). When I used the dialog box for T Tests and Non Parametric Statistics for two independent samples, selecting non parametric test (for obtaining Mann Whitney results), including simulation (10000 iterations) and exact test for p-value, using continuity correction, the program got an error for p-value simulation (a message related to a mistake in a matrix calculation), and I obtained N/A (not a formula: a text N/A) instead of a valid result. I used the complement in Excel 2010, Spanish version.
After that, with the purpose of detecting if the last release was the problem, I followed the same steps in an earlier release of Real Statistics (downloaded in July 8th, 2021), and I could get results for p-value simulation (although Excel turned slow because of matrix calculations after that).
Is it possible that matrix operation upgrading since July 2021 be the source of the bug?
I’ll be waiting for your comments.
Thank you.
William Agurto.
Hello Charles,
thank you for the article, it helped me massively with getting into MW formula. I have one question. Do you have proof on the adjusted variance of the U? I was thinking of using the linearity of variance with a combination of the first formula mentioned at the beginning.
But I just cannot finish it to the correct answer.
Thank you and cheers from Czechia.
Anna
Hello Anna,
Good to hear from someone from Czechia.
Which adjustment are you referring to? The ties adjustment or the continuity adjustment or something else?
Charles