We now extend the goodness-of-fit test based on the characteristic function to Multivariate Normal distributions.
Multivariate Normal Distribution
Let X be an n × d matrix where each row represents a data vector. We test to see whether these vectors are multivariable normally distributed. We assume that n is between 10 and 400 and d is between 2 and 5. Finally we use Xj to represent the jth column of X consisting of the elements [x1j … xnj]T.
As usual, we estimate the parameters of the multivariate normal distribution from the data via the 1 × d mean vector μ by X̄ and the d × d covariance matrix Σ by S.
![]()
![]()
We normalize X via
![]()
and then calculate the test statistic (as in Goodness-of-Fit Test based on the Characteristic Function).
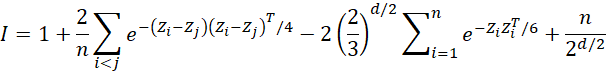
where Zj is the jth column of Z.
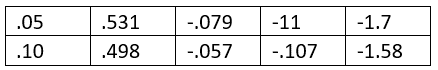
The critical values of the test statistic are
d = 2, n ≥ 10
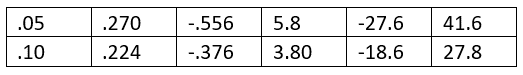
The last column of this table shows the coefficients for the n-2 term.
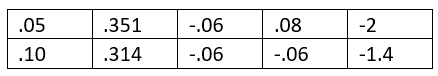
d = 3, n ≥ 12
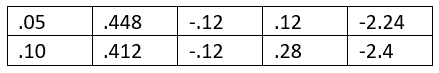
d = 4, n ≥ 12
d = 5, n ≥ 12
Example
Example 1: Repeat Example 1 from Multivariate Normality Testing (Mardia) using the ICF GoF methodology. The data is repeated in columns A and B of Figure 1.
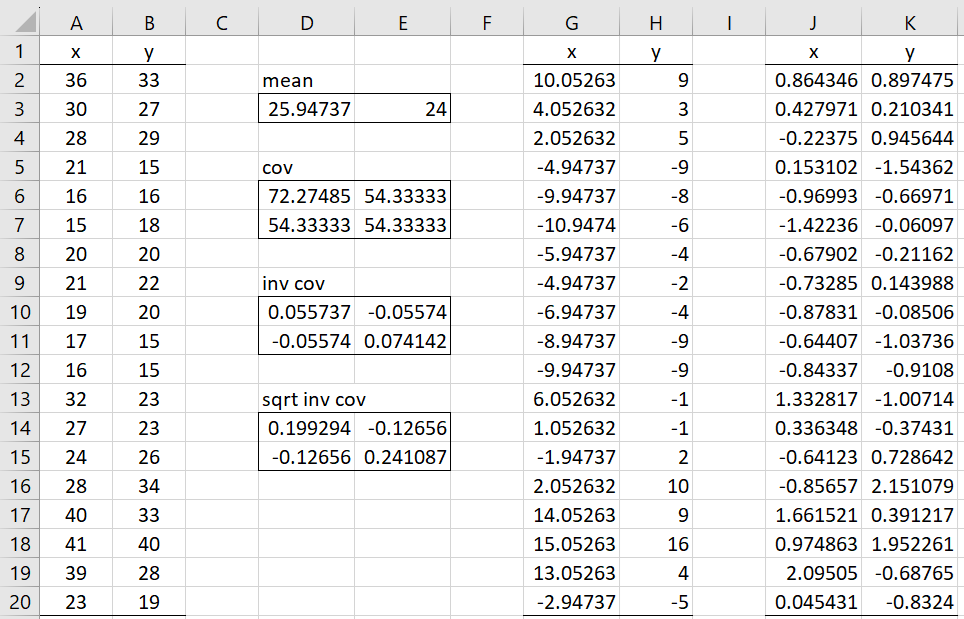
Figure 1 – GoF for the bivariate normal distribution (part 1)
Here, cells D3 and E3 contain the formulas =AVERAGE(A2:A20) and =AVERAGE(B2:B20).
Cells D6 and E7 contain the formulas =VAR.S(A2:A20) and =VAR.S(B2:B20). Cells D7 and E6 contain the formulas =COVARIANCE.S(A2:A20,B2:B20) and =D7. Alternatively, you can place the array formula =COV(A2:B20) or =MMULT(TRANSPOSE(A2:B20-D3:E3),A2:B20-D3:E3)/(COUNT(A2:A20)-1) in D6:E7.
Ranges D10:E11 and D14:E15 contain the array formulas =MINVERSE(D6:E7) and =MSQRT(D10:E11). You can now fill in columns G and H by inserting the formula =A2-D$3 in cell G2, highlighting G2:H20, and pressing Ctrl-R and Ctrl-D. Finally, you can fill in columns J and K by inserting the array formula =MMULT(G2:H20,D14:E15) in J2:K20.
The analysis continues in Figure 2. Here the values in columns J and K from Figure 1 are copied into columns B and C of a new worksheet as shown in Figure 2. Cell D4 contains the formula
=IF(D$1<$A4,EXP(-MMULT(TRANSPOSE(D$2:D$3)-$B4:$C4,D$2:D$3-TRANSPOSE($B4:$C4))/4),””).
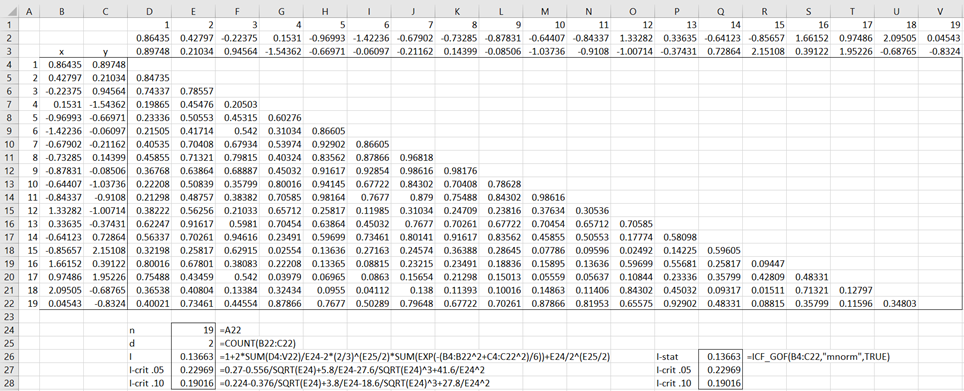
Figure 2 – GoF for the bivariate normal distribution (part 2)
Since I = .13663 < .19016 = I.10, we can’t reject the null hypothesis, and have evidence to support the conclusion that the data comes from a bivariate normal distribution.
You can also use the formula =ICF_GOF(B4:C22,”mnorm”,TRUE) to get the same result. See Goodness-of-Fit Test based on the Characteristic Function for a description of the ICF_GOF function and its arguments.
Examples Workbook
Click here to download the Excel workbook with the examples described on this webpage.
References
Epps, T. W. (2014) Probability and statistical theory for applied researchers
https://books.google.co.uk/books?id=NCs8DQAAQBAJ&pg=PR4&lpg=PR4&dq=Epps,+T.+W.+Probability+and+statistical+theory+for+applied+researchers&source=bl&ots=GxU40vCNHu&sig=ACfU3U0vgZZndBfjMMmqYPQuCXAJf2jrow&hl=en&sa=X&ved=2ahUKEwiw5_3R-4KCAxVCgFwKHa2fA384FBDoAXoECAQQAw#v=onepage&q=Epps%2C%20T.%20W.%20Probability%20and%20statistical%20theory%20for%20applied%20researchers&f=false
Henze, N., & Zirkler, B. (1990). A class of invariant consistent tests for multivariate normality. Communications in statistics-Theory and Methods, 19(10), 3595-3617. https://www.semanticscholar.org/paper/A-class-of-invariant-consistent-tests-for-normality-Henze-Zirkler/6cd84d60ab6c23a93abe70622e2c0d950d68c8a8