We now extend the goodness-of-fit test based on the characteristic function to a logistic distribution.
Basic Concepts
We now show how to test whether the data set X = {x1, …, xn} follows a logistic distribution with pdf
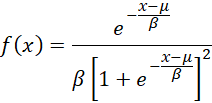
We can use the MLE estimates, but instead, for simplicity, we use the method of moments estimates as follows:
![]()
The test statistic is
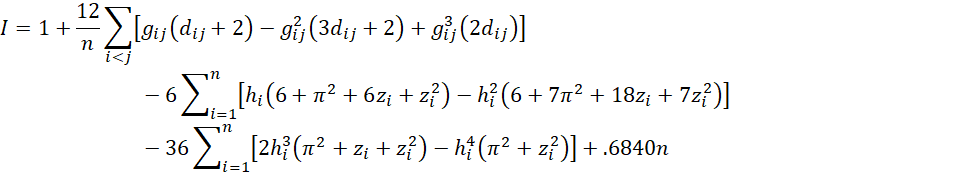
where
![]()
Note that gij is undefined when dij = 0, i.e. when zi = zj. When |dij| < .1, we use the approximation
![]()
The critical values for this test statistic are
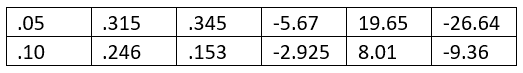
The last column of this table shows the coefficients for the n-2 term.
Example
Example 1: Decide whether the data in B3:B16 of Figure 1 fits a logistic distribution.
Figure 1 also begins the analysis. Here cell C3 contains the formula =IF(D$1<$A3,$C3-D$2,””) and cell D3 contains the formula =IF(D$1<$A3,$C3-D$2,””), i.e. dij.
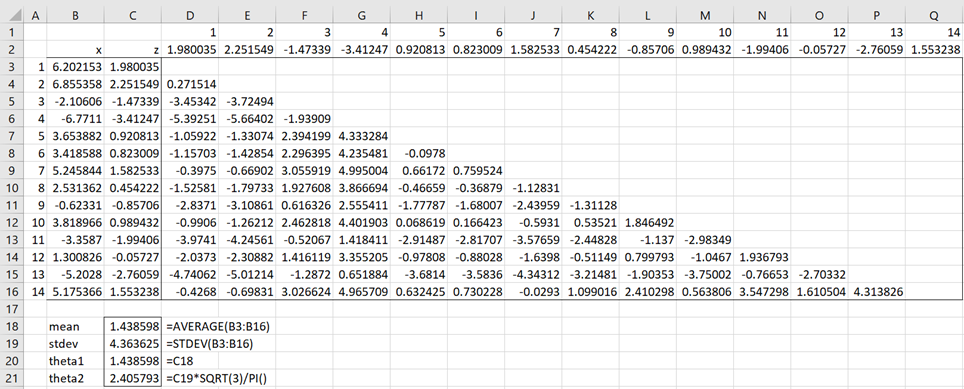
Figure 1 – GoF for logistic distribution (part 1)
The analysis continues in Figure 2. Here cell S3 contains the formula =IF(D3=””,””,EXP(D3)/(EXP(D3)-1)), i.e. gij.
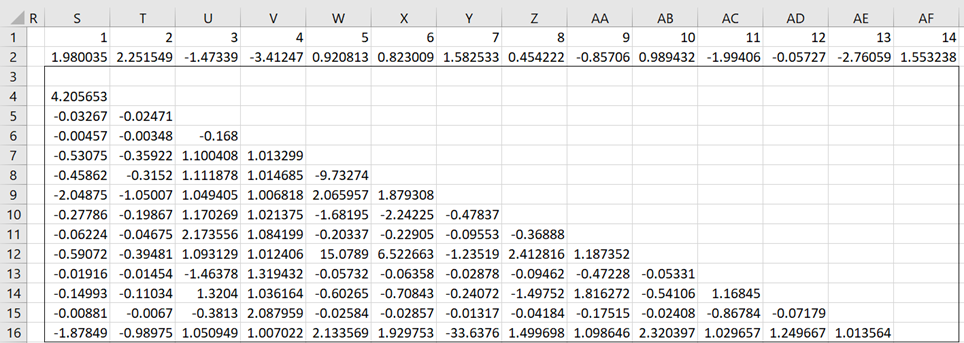
Figure 2 – GoF for logistic distribution (part 2)
The analysis continues in Figure 3. Cell AH3 contains the formula =IF(S3=””,””,S3*(D3+2)-S3^2*(3*D3+2)+S3^3*(2*D3)).
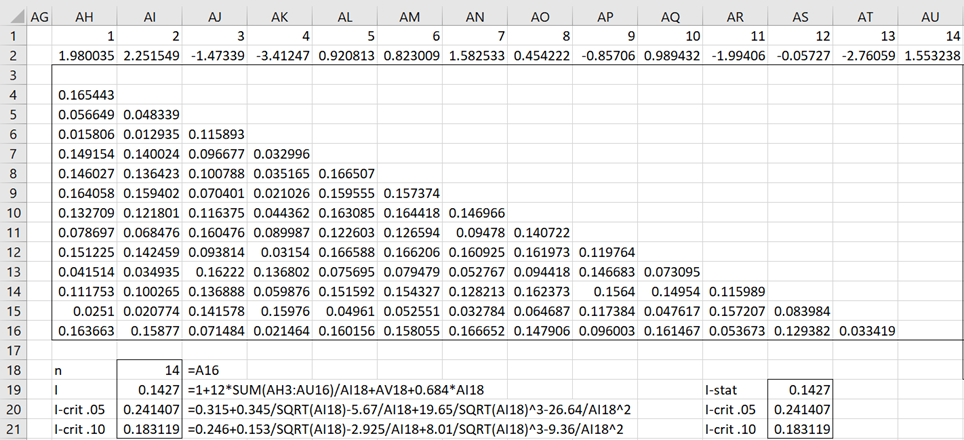
Figure 3 – GoF for logistic distribution (part 3)
Cell AI19 contains a reference to cell AV18, which is described in Figure 4.
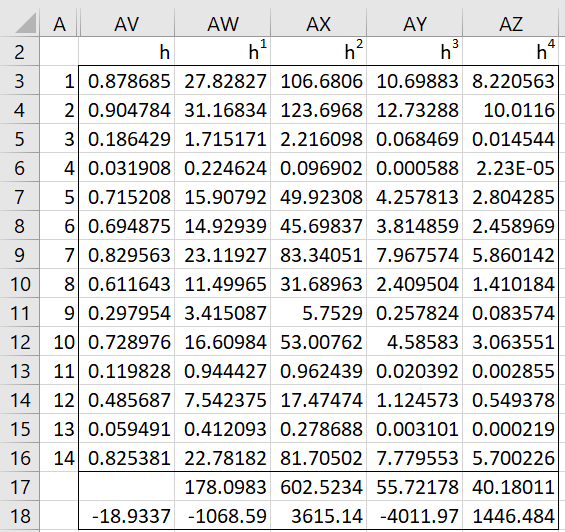
Figure 4 – GoF for logistic distribution (part 4)
Now, insert the formulas shown in the first five rows of Figure 5 in row 3 of Figure 4, highlight range AV3:AZ16, and press Ctrl-D. Next, insert the formula =SUM(AW3:AW16) in cell AW17, highlight AW17:AZ17, and press Ctrl-R. Finally, insert the formulas shown in the last five rows of Figure 5 in row 18 of Figure 4.
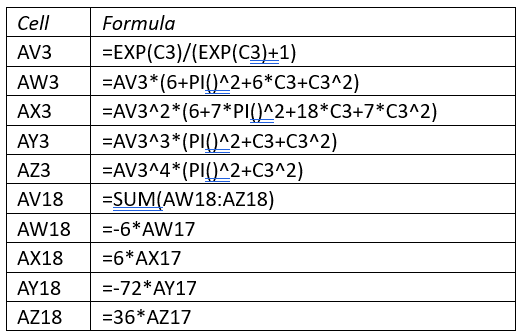
Figure 5 – Key formulas in Figure 4
Referring to Figure 3, we see that I = .1427 < .183119 = I.10, and so we can’t reject the null hypothesis that the data comes from a logistic distribution.
Using the ICF_GOF worksheet function
We get the same result using the formula =ICF_GOF(A3:A16,”logistic”,TRUE,0) as shown on the left side of Figure 6. This is not surprising since the values in A3:A16 were calculated using the formula =LOGISTIC_INV(RAND(),2,5).
The analysis for data in column G of Figure 6 shows a significant result, thereby providing evidence that these data don’t come from a logistic distribution. In fact, they were calculated via the formula =LOGNORM_INV(RAND(),2,5).
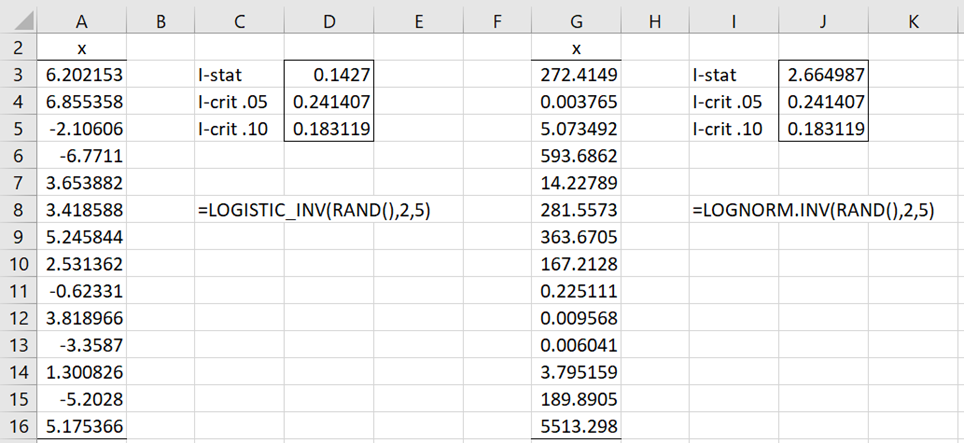
Figure 6 – GoF worksheet formulas for logistic distribution
See Goodness-of-Fit Test based on the Characteristic Function for a description of the ICF_GOF function and its arguments.
Examples Workbook
Click here to download the Excel workbook with the examples described on this webpage.
Reference
Epps, T. W. (2014) Probability and statistical theory for applied researchers
https://books.google.co.uk/books?id=NCs8DQAAQBAJ&pg=PR4&lpg=PR4&dq=Epps,+T.+W.+Probability+and+statistical+theory+for+applied+researchers&source=bl&ots=GxU40vCNHu&sig=ACfU3U0vgZZndBfjMMmqYPQuCXAJf2jrow&hl=en&sa=X&ved=2ahUKEwiw5_3R-4KCAxVCgFwKHa2fA384FBDoAXoECAQQAw#v=onepage&q=Epps%2C%20T.%20W.%20Probability%20and%20statistical%20theory%20for%20applied%20researchers&f=false