We now extend the goodness-of-fit test based on the characteristic function to Gumbel and Weibull distributions.
Gumbel Distribution
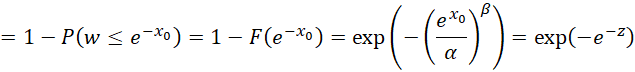
We now show how to test whether the data set X = {x1, …, xn} follows a Gumbel distribution with pdf and cdf
![]()
where z = (x – μ)/β ≈ (x – θ1)/θ2.
The MLE for θ1 and θ2 are the solutions to the following equations:
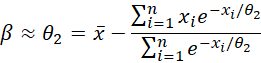
![]()
You can estimate these values by using Real Statistics’ worksheet function GUMBEL_FIT.
The test statistic is
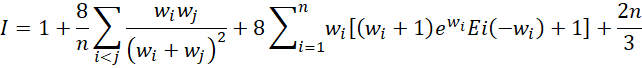
where
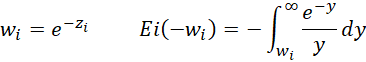
Ei is called the exponential integral. You can calculate it by using Real Statistics’ INTEGRAL function (see Numerical Integration Function). The Ei worksheet function, described below, returns a more accurate value for this function.
For those of you who are not familiar with integration, don’t worry. You only need to use the Ei function.
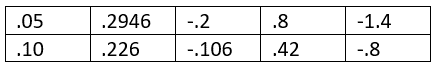
The table of critical values is as follows:
Worksheet Function
Real Statistics Function: The Real Statistics Resource Pack provides the following worksheet function.
Ei(x) = exponential integral at x
Example
Example 1: Determine whether the data in B3:B12 of Figure 1 follows a Gumbel distribution
Figure 1 shows the analysis. Here cell C3 contains the formula =(B3-C$14)/C$15, cell D3 contains =EXP(-C3), and E2:N2 contains =TRANSPOSE(D3:D12). Cell E3 contains =IF(E$1<$A3,$D3*E$2/($D3+E$2)^2,””) and cell O3 contains =D3*((D3+1)*EXP(D3)*Ei(-D3)+1). The other cells are filled in using Ctrl-D and Ctrl-R as described in Example 1 of Goodness-of-Fit Test based on the Characteristic Function.
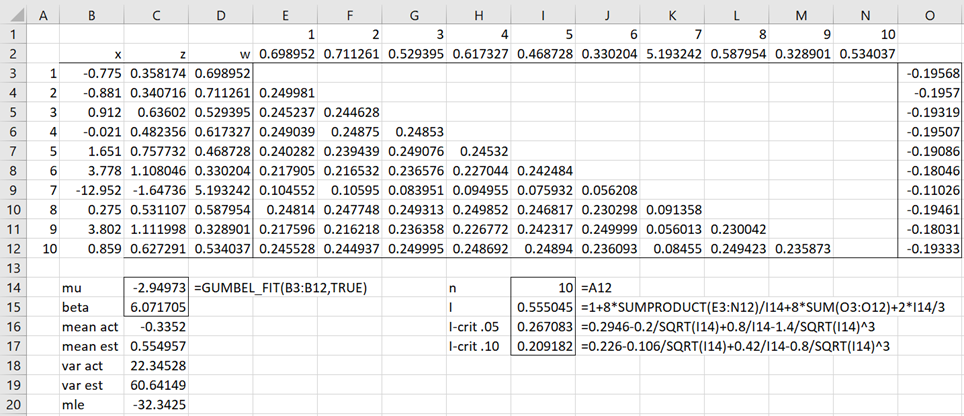
Figure 1 – GoF for Gumbel distribution
We see that I = .554045 > .267083 = I.05, which is a significant result, providing evidence that the data isn’t Gumbel distributed. We get the same result using the formula =ICF_GOF(B3:B12,”gumbel”,TRUE). See Goodness-of-Fit Test based on the Characteristic Function for a description of the ICF_GOF function and its arguments.
Weibull Distribution
For data X = {x1, …, xn} from a Weibull distribution with cdf
![]()
Let x = –ln w. Thus, w = e–x. The cdf for x at x0 is
![]()
Let θ1 = –ln α and θ2 = 1/β. Thus, α = exp(–θ1) and β = 1/θ2. It now follows that
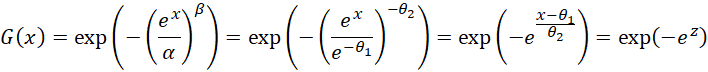
where z = (x – θ1)/θ2.
It now follows that w ∼ Weibull(α, β) is equivalent to –ln w ∼ Gumbel(–ln α, 1/β).
Example
Example 2: Determine whether the data in B2:B13 of Figure 2 follows a Weibull distribution.
We can use the transformation described above to obtain the data in column D of Figure 2. E.g. cell D2 contains the formula =-LN(B2). The data in column B follows a Weibull distribution if the data in column D follows a Gumbel distribution.
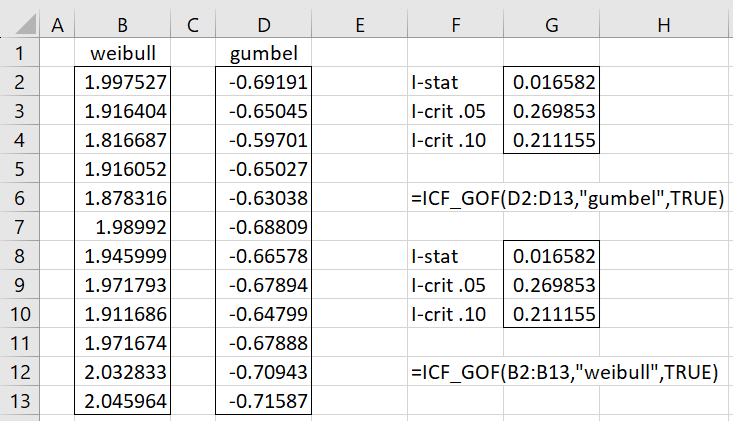
Figure 2 – GoF for Weibull distribution
We see from G2:G4 that I = .016582 < .211155 = I.10, which result provides evidence that the data in column D follows a Gumbel distribution, and so the data in column B follows a Weibull distribution. We get the same result using the formula =ICF_GOF(B2:B13,”weibull”,TRUE).
Examples Workbook
Click here to download the Excel workbook with the examples described on this webpage.
References
Epps, T. W. (2014) Probability and statistical theory for applied researchers
https://books.google.co.uk/books?id=NCs8DQAAQBAJ&pg=PR4&lpg=PR4&dq=Epps,+T.+W.+Probability+and+statistical+theory+for+applied+researchers&source=bl&ots=GxU40vCNHu&sig=ACfU3U0vgZZndBfjMMmqYPQuCXAJf2jrow&hl=en&sa=X&ved=2ahUKEwiw5_3R-4KCAxVCgFwKHa2fA384FBDoAXoECAQQAw#v=onepage&q=Epps%2C%20T.%20W.%20Probability%20and%20statistical%20theory%20for%20applied%20researchers&f=false
Wolfram MathWorld (2023) Exponential integral
https://mathworld.wolfram.com/ExponentialIntegral.html