Data Analysis Tool
Real Statistics Data Analysis Tool: The Real Statistics Resource Pack provides the Goodness of Fit data analysis tool, which supports the following tests:
- Two-Sample Kolmogorov-Smirnov Test
- One-Sample Anderson-Darling Test
- Two-Sample Anderson-Darling Test
- Chi-square Goodness of Fit Test
We now give three examples of the use of this data analysis tool.
Two Sample Kolmogorov-Smirnov Test
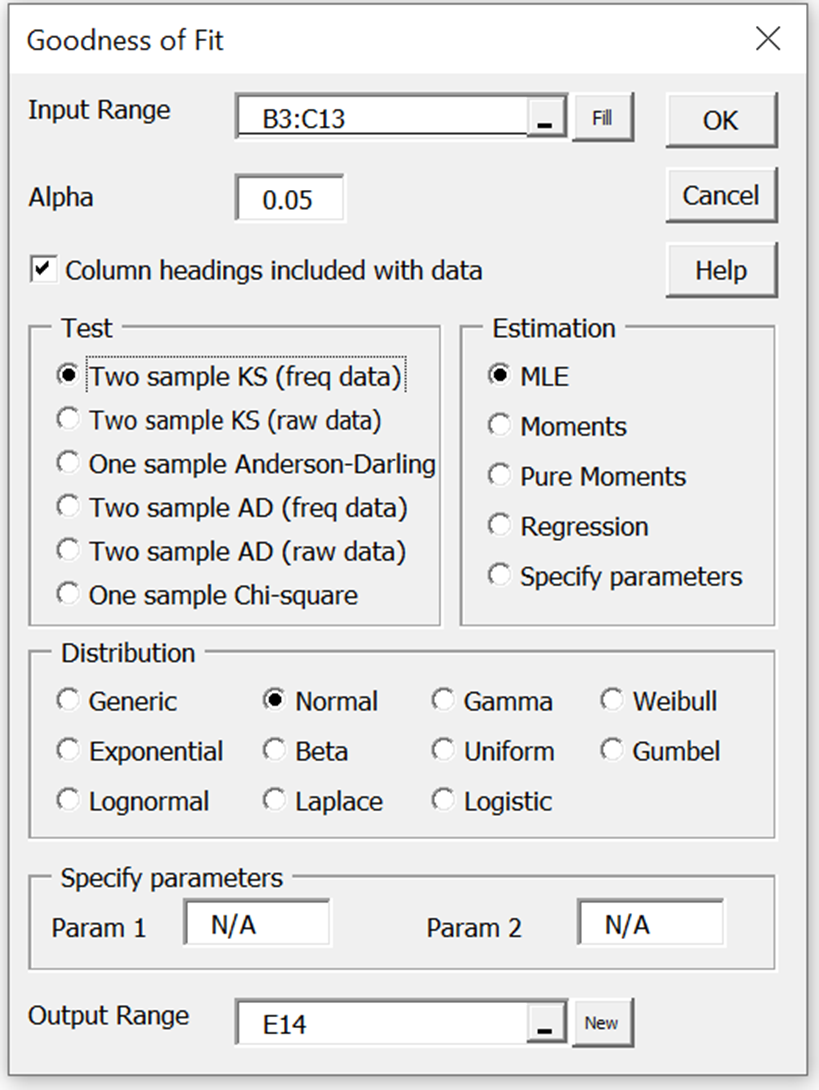
We now show how to perform Example 1 of Two Sample Kolmogorov-Smirnov Test using the Goodness of Fit data analysis tool. Press Ctrl-m and double-click on the Goodness of Fit option from the main menu (or from the Misc tab of the MultiPage interface). Fill in the dialog box that appears as shown in Figure 1.
Figure 1 – Goodness of Fit Tests data analysis tool
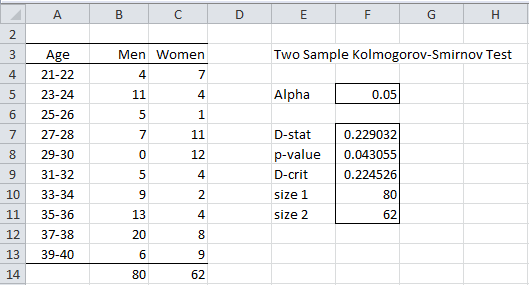
Upon clicking on the OK button, the output shown in range E3:F11 of Figure 2 appears.
Figure 2 – Two Sample KS Test
In this example, the input data (range A3:C13) is in the form of a frequency table. The data analysis tool can also be used with data in raw data format. E.g. for Example 2 of Two Sample Kolmogorov-Smirnov Test, when the dialog box in Figure 1 appears, enter J3:K11 (see Figure 3 of Two Sample Kolmogorov-Smirnov Test) in the Input Range and select the Kolmogorov-Smirnov (raw) test.
One Sample Anderson-Darling Test
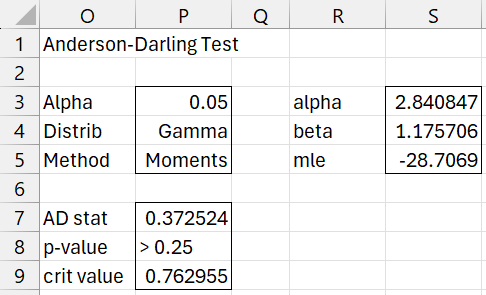
To repeat Example 2 of Anderson-Darling Test, press Ctrl-m, choose the Goodness of Fit data analysis tool, and fill in the dialog box that appears as shown in Figure 1 with Input Range A3:A18 and select the One sample Anderson-Darling, Moments, and Gamma options. After pressing the OK button, the output shown in Figure 3 is displayed.
Figure 3 – Anderson-Darling data analysis tool
Note that the Beta and Uniform options are not supported for the Anderson-Darling test. The Regression option is only valid for the Weibull distribution.
Note too that when the Specify parameters option is selected, you need to explicitly enter values for Param1 and possibly Param2. If you select the Normal option, enter the mean and standard deviation in the Param1 and Param2 fields. For the Expon option, enter the lambda value in Param1. For the other distribution choices, enter the alpha and beta values in Param1 and Param2. These fields are ignored when the Generic option is chosen.
Chi-square Goodness of Fit
To repeat Example 1 of Chi-square Goodness of Fit Test, press Ctrl-m, choose the Goodness of Fit data analysis tool, and fill in the dialog box that appears as shown in Figure 1 with Input Range A3:B11 and select the Chi-square Goodness of Fit, Moments, and Normal options. After pressing the OK button, the output shown on the left side of Figure 4 is displayed.
Figure 4 – Chi-square goodness of fit data analysis
This is the same output that we saw on the left side of Figure 2 of Chi-square Goodness of Fit Test. To repeat the analysis with the specific values of 2 and 1 for the mean and standard deviation, respectively, we follow the same steps as described above, except that we choose the Specify parameters option instead of the Moments option. The output is shown on the right side of Figure 4. This output is the same as we saw on the right side of Figure 2 of Chi-square Goodness of Fit Test.
Examples Workbook
Click here to download the Excel workbook with the examples described on this webpage.
Reference
D’Agostino, R. B., Stephens, M. A. (1986) Goodness-of-fit techniques. Marcel Dekker, Inc.
https://dblp.org/rec/journals/sac/Genz04.html


Hi Charles, the link for “One-Sample Kolmogorov-Smirnov Test” leads to another page.
Thank you for informing me about this link error.
I have now corrected this and clicking on the link should direct you to the correct page.
I appreciate your help.
Charles
good morning charles sir, I would like to ask you further information about chi square test use in thesis so how to calculate the given frequency. please sir tell us whole procedure step by step with example and how to prepared master chart?
so please sir give me your email address because i will send you prepared my master chart and suggest the manipulation data.
You can find my email address at Contact Us
Please explain what you are trying to accomplish and what the various information in your chart means. It would be best to send me the data in the form of an Excel spreadsheet.
Charles
Dear Charles,
I have to thank you for Real Statistics, it is really a great and helpful tool. We have decide to use it in Advanced Statistics course at our faculty. Thanks to Real Statistics, we can (quite simply) solve tasks that we could not do otherwise in Excel.
I have a problem with Goodness of Fit tool. If try to use one sample Chi-square test to test uniform distribution with this tool, function FIT_TEST(B11:C15,0,TRUE,,W25) is used to generate output table – with error. I have tried different combinations of input settings but Distrib is always displayed as Generic and the Method as N/A.
Maybe I am doing something wrong…
Thank you
Vaclav
Vaclav,
If you send me an Excel file with your data and output from the FIT_TEST function, I will try to figure out why you are getting an error.
Charles
I encountered the same problem. Did you have it solved?
Hi Sir,
Estimation is based on any method that we choose. How can I make use of output to calculate the discharge(Example: I have considered Peak annual discharge as Input range) How do I make use of these analysis to calculate discharge for different return period??
Sorry, but I don’t understand your question.
Charles