Steps in the permutation test
The (random) permutation version of the Brunner-Munzel test is performed as follows:
- Calculate the value of the t statistic for the sample data (using the BM test).
- Randomly permute the data in the combined sample and calculate the t statistic based on the permutation of the sample value.
- Repeat step #2 a large number of times (say k = 10,000) to obtain t values t1, …, tk.
- Find the values tkα/2 and tk(1-α/2).
- Reject the null hypothesis if t < tkα/2 or t > tk(1-α/2).
Alternatively, steps 4 and 5 can be replaced by
- p-value = (# of ti ≤ -|t| + # of ti ≥ |t|) / k
- Reject the null hypothesis if p-value < α
Effect size and confidence interval
As described in Brunner-Munzel Test Example, we can obtain a confidence interval for the relative effect size via
![]()
The left side of the confidence interval is p-hat – t1-α/2 ⋅ s, and the right side is p-hat – tα/2 ⋅ s, where tα/2 is the left side critical value and t1-α/2 is the right-side critical value.
We can also use the Permutation BM test to obtain a confidence interval for the relative effect size by replacing these critical values by tkα/2 and tk(1–α)/2 in the sequence of t values created in step #3 above.
Example
Example 1: Use the Permutation BM Test to address Example 1 of Brunner-Munzel Test Example.
We show how this is done for 100 permutations. Normally, we would use many more permutations (typically 10,000).
We rewrite the data shown in columns A and B in stacked form as shown in columns D and E. Using the formula =INDEX(BM_TEST(E2:E12,E13:E22),3), we obtain the t-statistic -1.34567 shown in cell E24.
We now obtain one permutation of the sample data by placing the Real Statistics array formula =SHUFFLE(E2:E22) in array F2:F22. We obtain the other 99 permutations by highlighting the range F2:DA22 and pressing Ctrl-R. Similarly, we obtain the corresponding t-stats by highlighting range F24:DA25 and pressing Ctrl-R. The result is shown in Figure 1 (the middle 90 permutations are not displayed).
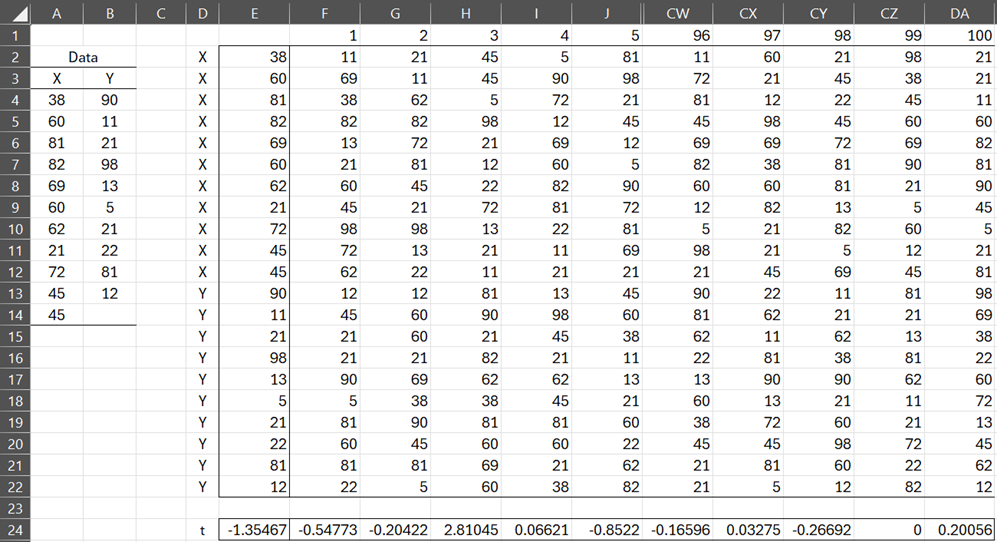
Figure 1 – Permutation BM Test (part 1)
The results of the test are now shown in Figure 2.
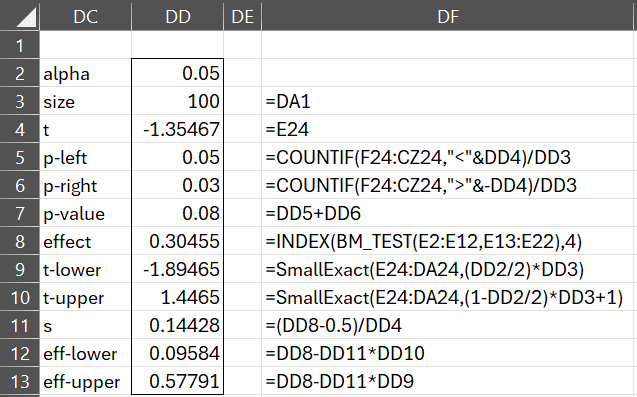
Figure 2 – Permutation BM Test (part 2)
Worksheet Function
The Real Statistics Resource Pack provides the following worksheet function for carrying out the Permutation Brunner-Munzel test in Excel.
BM_PTEST(R1, R2, lab, iter, alpha): returns a column array with the values p-value, p-left, p-right, t-stat, effect size, t statistic, CI-lower (effect size), CI-upper (effect size) for the Permutation BM test on the data in column arrays or cell ranges in R1 and R2.
lab and alpha are as for BM_TEST. iter = the number of permutations (default 10,000),
p-left is the p-value for the null-hypothesis P(x < y) > P(y < x) (equivalently p > .5) when t-stat < 0 and p-right is the p-value for the null hypothesis P(x < y) < P(y < x) (equivalently p < .5) when t-stat > 0. p-value is the two-tailed p-value for the null hypothesis P(x < y) = P(y < x) (equivalently p = .5).
To repeat Example 1 with a more realistic 10,000 permutations, we use the array formula =BM_PTEST(B3:B13, C3:C13, TRUE) to obtain the results shown in Figure 3.
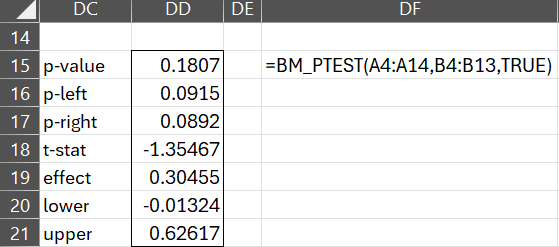
Figure 3 – Permutation BM Test with 10,000 permutations
We see that we don’t have sufficient evidence to reject the null hypothesis (p-value = .1807 > .05 = alpha). The effect size is .30455 with a 95% confidence interval of (-.01324, .62617).
If we were testing the one-sided null hypothesis p < .5, then p-value = .0925. If we were testing the one-sided null hypothesis p > .5, then p-value = 1-.0892 = .9108.
Examples Workbook
Click here to download the Excel workbook with the examples described on this webpage.
Links
References
Brunner, E., Munzel, U. (2000) The Nonparametric Behrens-Fisher problem: Asymptotic theory and a small-sample approximation
https://community.jmp.com/t5/JMP-Wish-List/Brunner-Munzel-test/idi-p/631723?attachment-id=17778
Nowak, C. P., Pauly, M., Brunner, E. (2022) The nonparametric Behrens-Fisher problem in small samples
https://arxiv.org/pdf/2208.01231
Karch, J. D. (2021) Psychologists should use Brunner-Munzel’s instead of Mann-Whitney’s U test as the default nonparametric procedure.
https://osf.io/preprints/psyarxiv/kgdwn
Noguchi, K., Konietschke, F., Marmolejo-Ramos, F., Pauly, M. (2021) Permutation tests are robust and powerful at 0.5% and 5% significance levels
https://link.springer.com/article/10.3758/s13428-021-01595-5
Karch, J. D. (2022) Choosing between the two-sample t test and its alternatives: a practical guide
https://osf.io/preprints/psyarxiv/ye2d4
Pauly, M., Asendorf, T., Konietschke, F. (2014) Permutation tests and confidence intervals for the area under the ROC-curve
https://www.uni-ulm.de/fileadmin/website_uni_ulm/mawi.inst.105/Publikationen/FrankThomas_8.pdf