Example
Example 1: Use the Brunner-Munzel test to determine whether the stochastic equality null hypothesis holds based on the data in the two samples in ranges B3:B13 and C3:C12 of Figure 1.
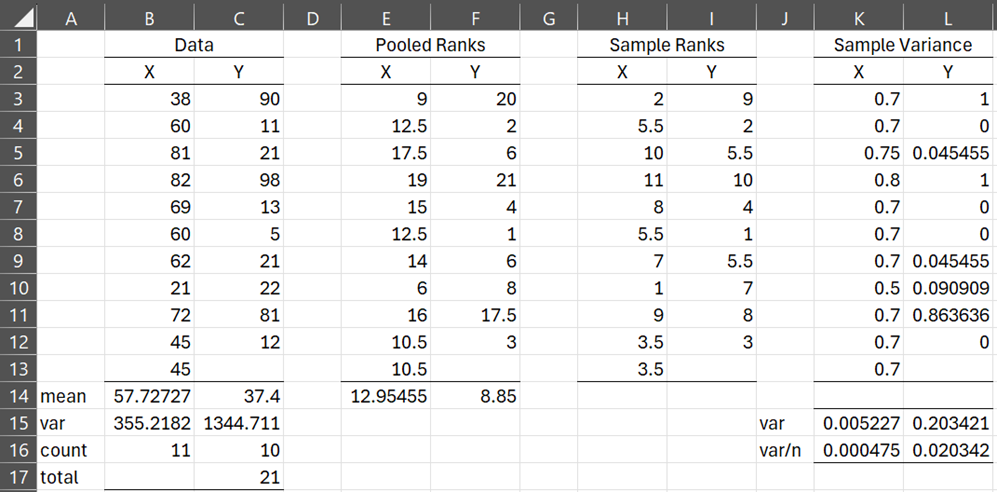
Figure 1 – Brunner-Munzel Test (part 1)
The pooled ranks for the 21 data elements are shown in columns E and F. E.g. the pooled rank of x11 in cell E3 is calculated by the formula =RANK.AVG(B3,B3:C13,1). The average pooled ranks for the two samples are shown in cells E14 and F14. E.g. the average rank for sample X is calculated by the formula =AVERAGE(E3:E13).
The non-pooled ranks are shown in columns H and I. E.g. the rank of x11 in the first sample is shown in cell H3, as calculated by the formula =RANK.AVG(B3,B3:B13,1).
The values of the Pij are shown in range K3:L13. E.g. P11 in cell K3 is calculated by the formula =(E3-H3)/C$16. The variance s12 for the first sample is shown in cell K15, and the variance s22 for the second sample is shown in cell L15. E.g. s12 is calculated by the formula =VAR.S(K3:K13).
Using the results from Figure 1, we show the output for the BM test in Figure 2.
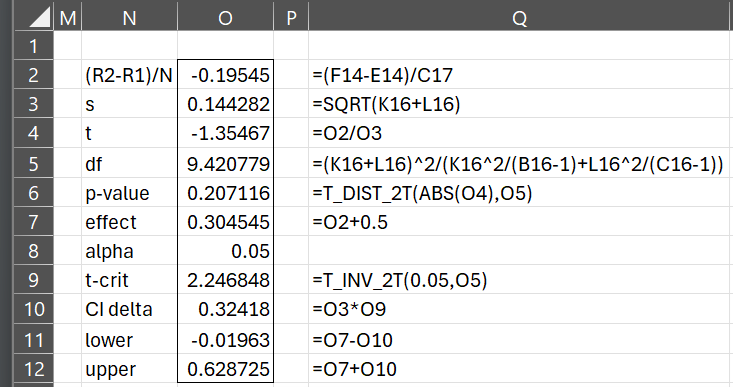
Figure 2 – Brunner-Munzel Test (part 2)
We see that the test statistic is t = -1.35467 with a p-value of 0.208549 based on a two-sided t-distribution with df = 9.420779. Thus, there is insufficient evidence for dismissing the null hypothesis.
Effect size and its confidence interval
The effect size is 0.304545. We can also calculate a 95% confidence interval of (-.02184, .630934) for the effect size in the usual way as shown in range O8:O12.
![]()
Observations
Note that using the Shapiro-Wilk test, we observe that the sample X is normally distributed (p-value = .65), while sample Y is not normally distributed (p-value = .0035).
Note too that the variances of the two samples are 355 and 1345, and so the homogeneity of variances assumption for the Mann-Whitney test is unlikely to hold.
Actually, for this example, the results from the t-test (p-value = .14) and Mann-Whitney (p-value = .14) are not very different from those obtained from the Brunner-Munzel test.
Note that we used the Real Statistics functions T_DIST_2T and T_INV_2T in cells O6 and O9 instead of the Excel worksheet functions T.DIST.2T and T.INV.2T. The Excel functions round down the value of df to the value INT(df), whereas the Real Statistics functions use the full value of df.
Worksheet Function
The Real Statistics Resource Pack provides the following worksheet function for carrying out the Brunner-Munzel test in Excel.
BM_TEST(R1, R2, lab, alpha): returns a column array with the values p-value, effect size, t-stat, df, CI-lower (effect size), CI-upper (effect size) for the two-tailed BM test on the data in column arrays or cell ranges in R1 and R2.
alpha is the significance level (default .05). If lab is TRUE (default FALSE), then a column of labels is appended to the output.
For Example 1, the formula =BM_TEST(B3:B13, C3:C13, TRUE) returns the output shown in Figure 3.
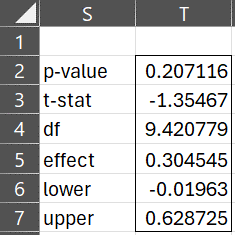
Figure 3 – Output from BM_TEST
Examples Workbook
Click here to download the Excel workbook with the examples described on this webpage.
Links
References
Brunner, E., Munzel, U. (2000) The Nonparametric Behrens-Fisher problem: Asymptotic theory and a small-sample approximation
https://community.jmp.com/t5/JMP-Wish-List/Brunner-Munzel-test/idi-p/631723?attachment-id=17778
Nowak, C. P., Pauly, M., Brunner, E. (2022) The nonparametric Behrens-Fisher problem in small samples
https://arxiv.org/pdf/2208.01231
Karch, J. D. (2021) Psychologists should use Brunner-Munzel’s instead of Mann-Whitney’s U test as the default nonparametric procedure.
https://osf.io/preprints/psyarxiv/kgdwn