Using MANOVA
MANOVA can be used instead of a Mixed Two-way Repeated Measures ANOVA (1W+1B), especially when the sphericity assumption doesn’t hold. We illustrate the approach by repeating Example 1 of Two Factor Repeated Measures ANOVA.
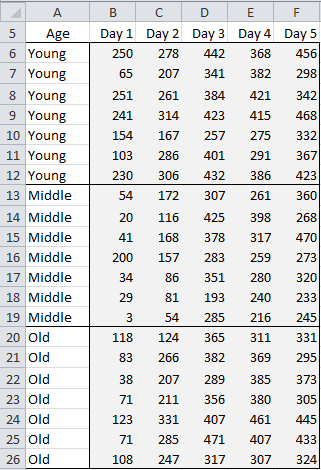
Example 1 A new drug is tested on a random sample of insomniacs: 7 young people (20-40 yrs), 7 middle-aged people (40-60 yrs) and 7 older people (60+ yrs). The number of minutes each person sleeps per night is recorded for 5 successive nights in Figure 1. Determine whether the drug is effective.
Figure 1 – Data for Repeated Measures Analysis
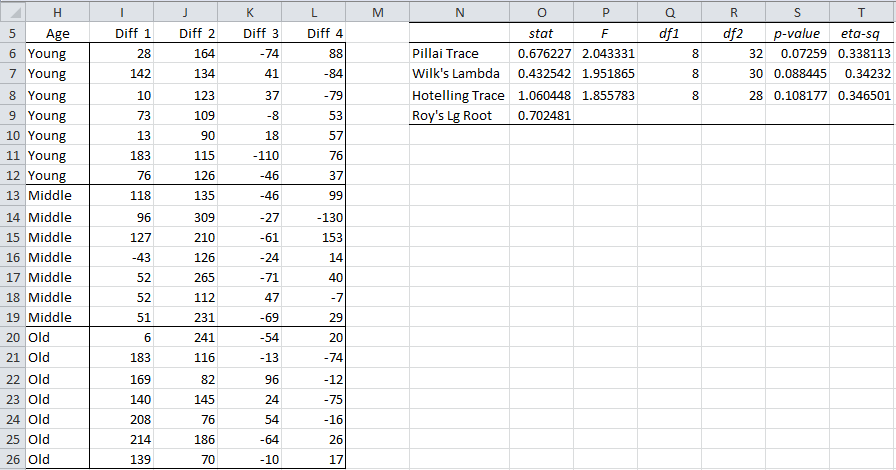
As described in One Factor Multivariate Repeated Measures, we first calculate the differences between the data in the adjacent columns, as shown on the left side of Figure 2.
Figure 2 – Repeated Measures Analysis using MANOVA
MANOVA Data Analysis Tool
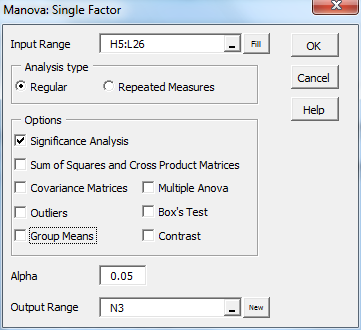
Next, we use the Real Statistics MANOVA Single Factor data analysis tool by pressing Ctrl-m, and selecting MANOVA: One Factor from the Multivar tab (or from the Multivariate Analysis option if using the original user interface). Finally, we fill in the dialog box that now appears as shown in Figure 3 and press the OK button.
Figure 3 – Single Factor MANOVA dialog box
The result is shown on the right side of Figure 2. All the tests show there is no significant difference between the mean hours of sleep for the three age groups. Interestingly enough this is the opposite conclusion from the univariate test.
Observation: It is important that none of the labels in range A6:A26 (and then H6:H26) be blank. This is acceptable for the univariate test since we had to inform the data analysis tool that there are 7 rows per group. For MANOVA the rows can appear in any order and the labels are mandatory.
Using Repeated Measures Option to MANOVA
We can also use the Repeated Measures option to the Real Statistics MANOVA: One Factor data analysis tool to carry out this test directly without having to subtract the values in adjacent columns. To perform the analysis for Example 1, press Ctrl-m, and repeat the steps described above to produce the dialog box shown in Figure 3. This time insert A5:F26 in the Input Range field and select Repeated Measures as the Analysis Type.
The output is similar to that shown in Figure 2.
Note that we can also select any of the various options shown in Figure 3, although in the current release of the software any Contrasts which rely on the fact that the columns are a repeated-measures factor have to be performed using the Repeated Measures ANOVA data analysis tools using the input data in range H5:L26.
Approach with two dependent variables
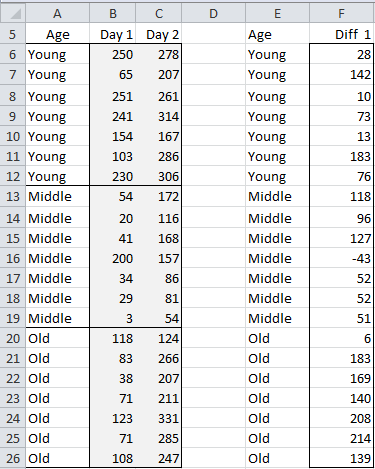
Example 2: Perform the analysis from Example 1 using the data shown on the left side of Figure 4 (i.e. range A5:C26).
Figure 4 – Data for with Two Dependent Variables
We can use the MANOVA: One Factor data analysis tool on range A5:C26, selecting the Repeated Measures option as described above. Alternatively, we can manually create the differences as shown on the right side of Figure 4 (e.g. by inserting the formula =C6-B6 in cell F6, highlighting range F6:F26 and pressing Ctrl-D), and then using MANOVA: One Factor data analysis tool on range F5:F26.
We can also use the Single Factor ANOVA data analysis tool inserting E6:F26 in the Input Range field and selecting Standard (stacked) format as the Input Format. The output is shown in Figure 5.
Figure 5 – Analysis using Single Factor ANOVA
The results from all three approaches will be similar.
Examples Workbook
Click here to download the Excel workbook with the examples described on this webpage.
References
Rencher, A.C. (2002) Methods of multivariate analysis (2nd Ed). Wiley-Interscience, New York.
http://math.bme.hu/~csicsman/oktatas/statprog/gyak/SAS/eng/Statistics%20eBook%20-%20Methods%20of%20Multivariate%20Analysis%20-%202nd%20Ed%20Wiley%202002%20-%20(By%20Laxxuss).pdf


Dear Sir,
As shown from the results of multivariate repeated measurements with two factors (1 Between, and 1 within) there is no separate results for both of age and days and interaction. Is that right?
when it is right, can we do that?
thank you
Adel
Hello Adel,
You can think of this as a test for only the between subjects factor age. The data consists of vectors of days information.
You can study subsets of the age and days as post-hoc tests.
Charles
I’m assessing pretest, posttest, and gain scores after an intervention for 2 moderately related scores of spatial skill. Can I put these 6 scores into Manova as 6 dependent variables and assess the independent main effect of gender, SES, and time? Or, do I need repeated Manova for the gain scores? Thank you!!!
If I understand the scenario properly, it seems that you can use MANOVA (or repeated measures ANOVA) with two independent (between subject) factors and 6 (within subject) dependent factors.
If you don’t need to test the before and after values, then tests on the gain would simplify the analysis. Now 6 within subject factors gets reduced to 3.
Charles
Greetings,
First of all, I want to say that this site has been a great help for me.
My question is this:
I have a 2X2 setup (2 sexes, 2 genotypes, 1 treatment for all), followed over time with 30 different measurements of the same variable (namely, body weight). Therefore, 2 factors between and one factor within. Groups are not exactly equal to start (they are close, an estimation might be acceptable), and there are some unplanned dropouts along the way (making this trickier). Excel’s built-in Analytical Tools cannot handle it.
My table includes all the data dispersed, but I can easily group them if needed.
In the example above, the two factors include the time points (1 within and 1 between). How would include a second factor between? From my understanding of the Real Statistics package, it’s not supported. At least I have not been able to find the proper test to run using it.
I would appreciate any help
Thanks for the excellent site!
Sorry Martin, but Real Statistics doesn’t handle this situation and I don’t have a good reference for this situation.
Charles
Hello! Your website has been of great utility to me while studying for a research project. I would be greatly obliged if you could help me out with this. I am conducting a study to look at the change in a self reported score before and after an intervention. There is no control group; all participants are subjected to the treatment (so there is just one population). Rather, there is a control question in the survey to deal with that. There are 2 dependent variables: the pre-intervention observation and the post-intervention observation; and I realise that this requires a repeated measures design.
My main independent variables are factors like age, gender, political affiliations, etc. of all the sampling units coming from the same population.
Would a one-way repeated measures MANOVA work here? Would I have to take the number of populations aspect in the exercise as 1?
I am an undergrad trying to learn this and would really appreciate your help! Thank you so much
Ananya
Ananya,
Specifically, what hypothesis or hypotheses do you want to test?
Charles
Hello!
I want to look at whether there is a change in the means of the dependent variable before and after the intervention, and what factors affect the change in the mean. Specifically, whether factors like political affiliation (left or right) or education (different levels of it) affect the degree of change in the dependent variable.
I have gone through some papers conducting similar research, and they have employed the one way repeated measures MANOVA approach.
Thank you so much for your help!
Ananya,
MANOVA might be a good approach, but this depends on the details. Suppose that you have three levels of education (High School, University and Graduate School), then you would need 6 samples: Left/High, Left/Univ, Left/Grad, Right/High, Right/Univ and Right/Grad. The dependent variables are Pre and Post. This would be a fit for Two-way MANOVA (with the repeated factor being pre/post). If you only cared about the change in mean you could simply use post-intervention minus pre-intervention score. In this case, you could use ordinary two-way ANOVA. Other approaches are also possible.
Charles
Hello Charles,
our study design is a mixed-ANOVA in which I have two between-subjects factors and one within-subjects factor.
The two between subjects design are gender (2 levels) and physical treatment (3 levels), so I have a total of 2×3 = 6 groups of subjects, and for each participant a biological variable is measured before and after the treatment (so, time is the within factor).
We want to verify if the 3 treatments induce different effects on the measured variable and if such effects are also gender dependent.
My problem is that I can’t find how to perform a priori power analysis for such a mixed model in order to determine the required sample size.
Do you think it could be safe to ignore that it’s a repeated measures test and to compute required sample size as if it were a 2-way fixed effects ANOVA with 6 groups?
Thank you very much for your help
Best Regards
Piero
Piero,
Sorry, but I don’t know how to perform power analysis for this type of test.
Charles
@Piero,
(mod: please tell me if I’m wrong).
If you have only two time points (Before-After) and you’re quite sure of the Before data in your sample, why not try expressing the variable as the difference (delta), resulting in a classical two-way ANOVA power analysis? It’s something many free tools do.
Hello.
Maybe you can also help us with our question, that would be very kind!
We have 2 independent variables:
–> 1 between-subjects-factor (GROUP) with 4 groups
–> 1 within-subjects-factor (TIME) with 2 timepoints (pretest/posttest)
We also have 4 dependent variables:
–> DV-1: Speed, DV-2: well-being; DV-3: agitation; DV-4: performence assessment
So we have 4 groups and are measuring the 4 DV at 2 timepoints (pre/post). We are going to conduct a Mixed-MANOVA (4×2 Between-Within-Subjects-MANOVA).
Our question is the following: Do you know if, in SPSS, we have to create just ONE Within-Subjects-Factor (time) and define our DVs at the field “Measure Names”, or if we have to define TWO Within-Subjects-Factors (time & subtest)? The internet shows different ways to do the MANOVA. An answer of you would be great!
Greetings, Manuel
Sorry, but I don’t use SPSS and so don’t know how to do this.
Charles
No problem. But thank you!!
Greetings, Manuel
Dear Charles,
Thank you for explanations about MANOVA.
I have
-5 dependent variables
-1 independent variable (treatment group and control group)
-and I will assess both groups at three different time points.
In this case, I will use one-way repeated measure MANOVA, right? or Mixed models?
Hello Naz,
You have two types of dependent variables: (1) the 5 dependent variables and (2) the time differences. This is beyond the capabilities of one-way repeated measure MANOVA.
Charles
Hello Charles,
Thank you so much for your answer. In this case, I think I need to run a two-way repeated measure MANOVA with my two independent variables: the group (i.e., treatment and control) and the time (i.e., T1, T2, and T3).
Hello Naz,
It seems so. This is not the test described on this webpage. Real Statistics does not support MANOVA with two sets of dependent variables.
Charles
Thank you, Charles.
Good Day,
Can you provide any direction or help on how to use excel to use data from a Repeated Measures Crossover Design experiment for analysis?
I have 2 groups. 1 group gets the test, then the control. The other group gets the control, then the test.
I’ve measured 2 things: Product and Process for everyone in both test and control.
Hello Diana,
There are a number of ways of handling crossover repeated measure designs. One approach is to use the one between subjects and one within subjects repeated measures design as described at
https://real-statistics.com/anova-repeated-measures/one-between-subjects-factor-and-one-within-subjects-factor/
Since you have two dependent variables Product and Process, you would need to use this approach twice, once for Product and once for Process. This is a reasonable approach provided there isn’t much correlation between Product and Process.
To handle Product and Process together you could use MANOVA. I have not yet explored this topic on the Real Statistics website, but the following approach will probably be useful and you only need to use the Hotelling’s T-Square version of MANOVA. You have two independent samples: (1) one for Group 1 and the other for Group 2. Each sample has two measurements (one for each dependent variable): (1) the treatment (what you called test) measure for Product minus the control measure for Product and (2) the treatment measure for Process minus the control measure for Process. See
https://real-statistics.com/multivariate-statistics/hotellings-t-square-statistic/hotellings-t-square-independent-samples/
https://real-statistics.com/multivariate-statistics/hotellings-t-square-statistic/hotellings-t-square-unequal-covariance-matrices/
You can also use Mixed models, but I have not yet explored this topic on the website.
Charles
Hi Charles,
Can we rune a Three-way ANOVA here?
You can run three/way ANOVA as described on the following webpages>
https://real-statistics.com/two-way-anova/real-statistics-support-three-factor-anova/
https://real-statistics.com/two-way-anova/three-factor-anova-without-replication/
Charles
Dear Charles,
First of all, thak you very much for your effort to develop such a useful tool!
My question is:
Is it possible (and how?) to study 22 dependent variables recorded 8 times in 40 subjects (23 controls and 17 treated) with some tool of the package? i. e.:
2 Treatments
8 times
22 variables
I´d like to know if there are treatments, days and interaction term significants.
Thanks a lot and best wishes!
Carlos,
I don’t completely understand your scenario.
1. Are you saying that you have 2 treatments, one with 23 subjects and the other with 17 subjects?
2. Are you saying that each subject is measured 8 times? Is each subject measured in day 1, day 2, …, day 8?
3. Are you saying that 22 types of characteristics are being measured for each of the 40 subjects?
Charles
Chalres,
The answers are yes, for all your questions.
The characteristics that are being measured are shape coordinates (landmarks). As I have 11 points, there are 22 (X and Y) shape coordinates, which in principle I can assume they are independent.
I think my problem is multivariate longitudinal data.
Carlos,
Yes, this does seem like a fit for MANOVA.
Charles
I thought so. But my problem is that the individuals that are being measured are the same across the experiment (it´s like a trial with a drug when patients are repeatedly examined for various reponse variables); and I cannot assume independence of the experimental units across days.
Therefore, I thought that MANOVA is not an option… but is there a way to overcome this problem? Is it implemented in RealStatistics…?
Thanks!
Carlos,
You can use repeated measures Manova in this case. Some versions of this are supported in Real Statistics.
Charles
I’m writing a research paper which requires made up data, and I chose to test the differences in Group A n=96 and Group B n=89 during 2 different time frames. at initial, then 1 year, than 3 year marks. I know that a MANOVA is the best tool to calculate statistical significance between the 2 groups, but how do I use the MANOVA to do this? I’ve tried i excel but a message pops up stating that I need a positive interger, or that I need more than 2 rows of data..Please help !
Thank you
Aba,
If you send me an Excel file with your data, I will try to find put what has gone wrong. See Contact Us for the email address.
Charles
Dear Sir,
I want to know if MANOVA with repeated measures is the right test in this case:
– 15 subjects
– 1 Independent Variable: audio system (3 levels)
– 7 Dependent Variables: (different constructs)
The same 15 subjects had to asses the 3 audio systems (simultaneous listening task) using the 7 rating scales (for each system).
Can I use the option “repeated measures” of the Real Statistics MANOVA data analysis tool (mac user) to analyze the data ?
How should I arrange the data in Excel ?
Thanks for your help,
Juan
Hi
Can you also advise me how to arrange data in excel. My data is in this format:
Subject day time alertness concentration
1. 1. 1. 6. 5
1. 1. 2 5 4
How can I rearrange this data. I know the standard format for manova but can you explain how I can easily rearrange this data instead of manual entries.
How many days/times values do you have?
Charles
I have 15 subjects. Two days. Four times and 10 constructs like alertness etc.
Sorry, but the version of MANOVA that is available on the Real Statistics Resource Pack doesn’t support this level of complexity.
Charles
Day 1: Experimental condition with social networking break
Day 2: Experimental condition with physically active break
Fatigue questionnaire is administered four times (T1, T2, T3, T4) on both days.
All 15 participants complete fatigue questionnaire on both days.
Fatigue questionnaire has 10 different constructs.