Equivalent Test Procedure
In Example 1 of One Factor Multivariate Repeated Measures, we chose to test the null hypothesis H0: μ0 = μ1 = μ2 = μ3 by testing an equivalent version of the hypothesis, namely H0: μ1 – μ0 = 0, μ2 – μ1 = 0, μ3 – μ2 = 0. We could instead test the equivalent null hypothesis H0: μ3 – μ0 = 0, μ3 – μ1 = 0, μ3 – μ2 = 0.
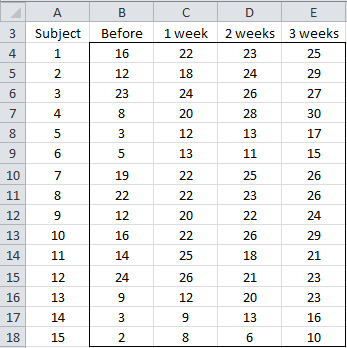
The data for this example is repeated in Figure 1.

Figure 1 – Example 1 Data
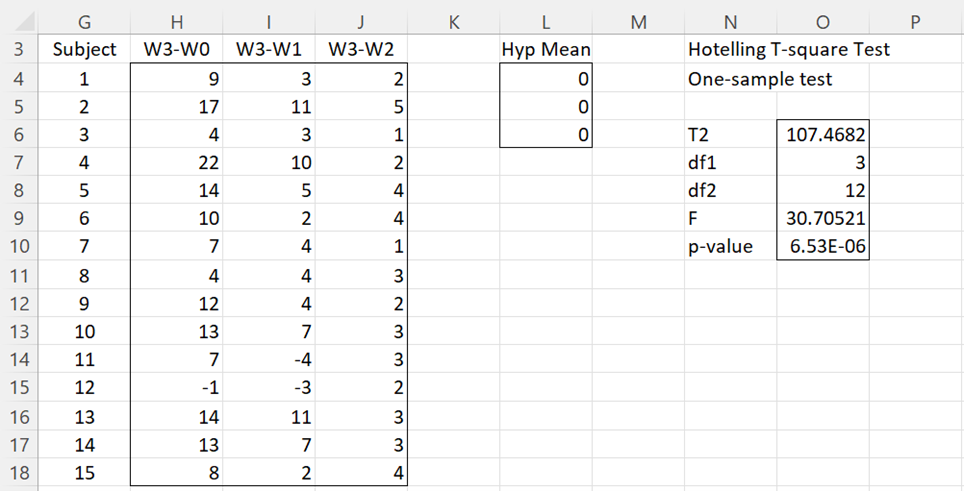
The results of this test using the revised null hypothesis are shown in Figure 2.
Figure 2 – Equivalent repeated measures test
Note that the results are the same as those shown in Figure 2 of One Factor Multivariate Repeated Measures.
Test with only Two Dependent Variables
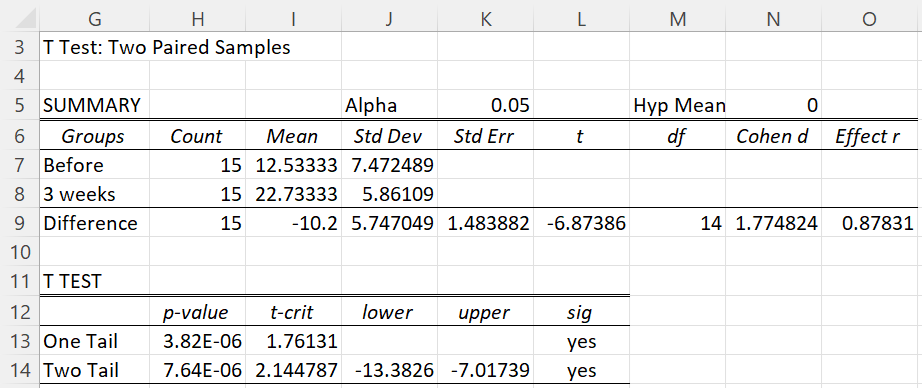
This approach works when there are 3 or more dependent variables. When there are only two dependent variables we can use the paired t-test. E.g. if for Example 1 we only had the data before the program and 3 weeks after the start of the program (columns B and E of Figure 1), we would conduct a paired t-test (or signed ranks test if the assumptions were not met) to obtain the results shown in Figure 3.
Figure 3 – Paired t-test
This is equivalent to the test t = D/(sD/√n) ∼ T(n–1), or even F = nD2/sD ∼ F(1, n–1) where D = the data consisting of the differences of the values in columns B and E (i.e. the data in column H of Figure 2). Thus, the results in Figure 3 are equivalent to a one-sample t-test on the data in D.
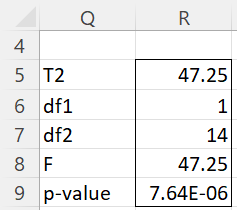
Actually, we can obtain similar results using the array formula =Hotelling(B4:B18,E4:E18,1,TRUE) or =Hotelling(H4:H13,,0,TRUE) to obtain similar results as shown in Figure 4.
Figure 4 – Hotelling version of the paired t-test
Examples Workbook
Click here to download the Excel workbook with the examples described on this webpage.
References
Rencher, A.C. (2002) Methods of multivariate analysis (2nd Ed). Wiley-Interscience, New York.
http://math.bme.hu/~csicsman/oktatas/statprog/gyak/SAS/eng/Statistics%20eBook%20-%20Methods%20of%20Multivariate%20Analysis%20-%202nd%20Ed%20Wiley%202002%20-%20(By%20Laxxuss).pdf


