Basic Approach
To generate a random vector that comes from a multivariate normal distribution with a 1 × k means vector and covariance matrix S, generate k random values from a (univariate) standard normal distribution to form a random vector Z. Next, find a k × k matrix A such that ATA = S (e.g. let A be the Cholesky decomposition of S). Then
+ AZ is a random vector.
To generate a random vector that comes from a bivariate normal distribution with means m1, m2, standard deviations s1, s2, and correlation coefficient r, we simply note that the means vector is = (m1, m2) and covariance matrix
![]()
Example
Example 1: Generate five random vectors from the multivariate normal distribution defined by the data from Example 1 of Multivariate Normality Functions.
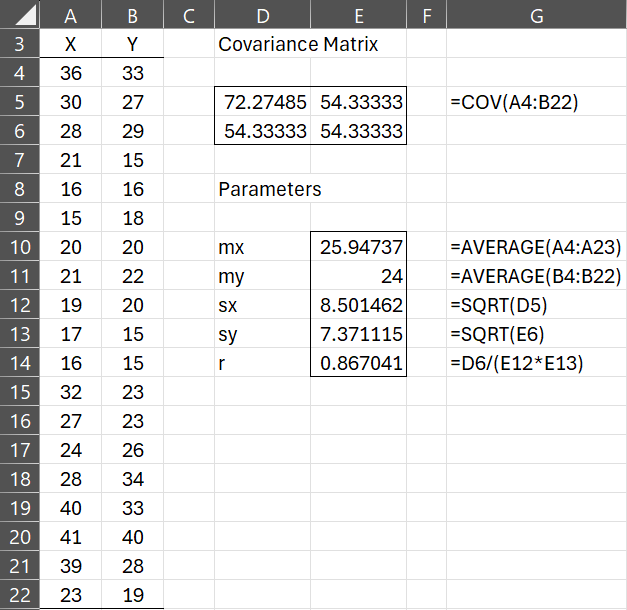
We start by repeating in Figure 1 the data values, mean vector, and covariance matrix from this example.
Figure 1 – Bivariate normal distribution example
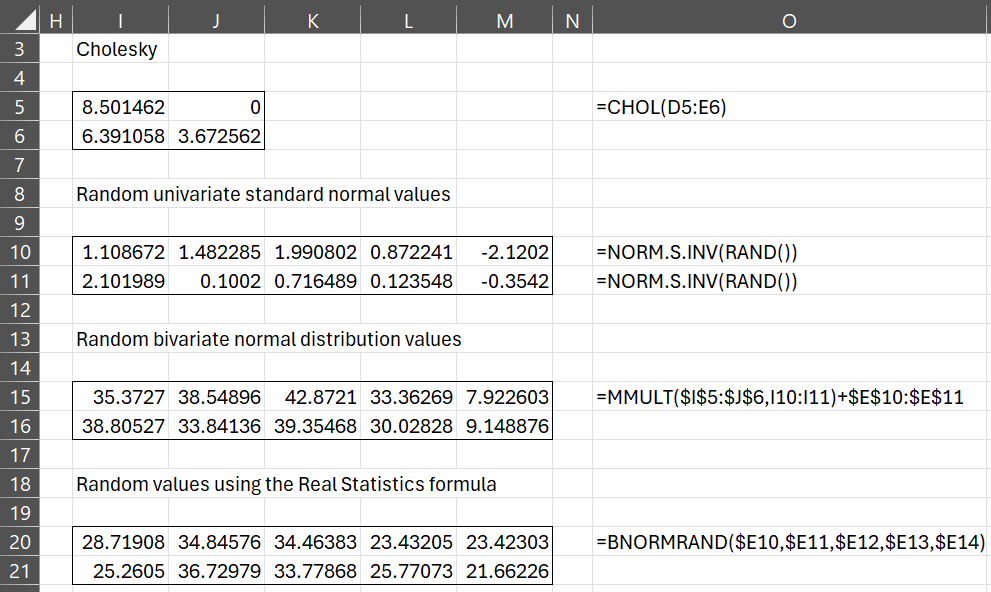
We next calculate the Cholesky decomposition of the covariance matrix using the Real Statistics CHOL worksheet function (range I5:J6), and then generate 10 random standard normal distribution values (range I10:M11) as shown in Figure 2.
Figure 1 – Random vectors from bivariate normal distribution
Finally, we generate the five random column vectors shown in ranges I15:I16, J15:J16, K15:K16, L15:L16, and M15:M16.
Worksheet Functions
Real Statistics Functions: The Real Statistics Resource Pack provides the following functions.
MNORMRAND(R1, R2): generates an array containing a random k × 1 vector from a k-dimensional multivariate normal distribution where R1 is the range that contains the k × 1 means vector and R2 is the range that contains the k × k covariance matrix
BNORMRAND(m1, m2, s1, s2, r): generates a random 2 × 1 vector from a bivariate normal distribution with means m1, m2, standard deviations s1, s2 and correlation coefficient r.
We can use the BNORMRAND function to generate the five random vectors for Example 1, as shown in ranges I20:I21, J20:J21, K20:K21, L20:L21, and M20:M21 of Figure 2.
Motivation
As we see in Other Multivariate Normal Properties, if Z is the standardization of vector X, then Z = (AT)-1(X–μ) where Σ = ATA. If you have a value for Z, then X can be expressed as X = μ + ATZ. Substituting for μ and S for Σ yields the expression X =
+ AZ shown previously.
The advantage of this expression is that a random value for Z can be found very easily. Since Z ∼ N(0, I), all the covariances are zero, and so we just need to create k univariate standard normal values to obtain the k × 1 vector Z. This yields a random value for X = + AZ.
Examples Workbook
Click here to download the Excel workbook with the examples described on this webpage.
References
Rencher, A.C. (2002) Methods of multivariate analysis (2nd Ed). Wiley-Interscience, New York.
http://math.bme.hu/~csicsman/oktatas/statprog/gyak/SAS/eng/Statistics%20eBook%20-%20Methods%20of%20Multivariate%20Analysis%20-%202nd%20Ed%20Wiley%202002%20-%20(By%20Laxxuss).pdf
Azevedo, C. L. N. (2016) The Multivariate Normal Distribution
https://www.ime.unicamp.br/~cnaber/mvnprop.pdf


Hello Prof. Thanks for your effort.
Pls i am finding it difficult to compute the rS1S2 in the variance covariance matrix of S above, i dont really know or to get the r; I hope you can assist me.
Thanks very much
Fountain,
This is explained in Figure 1 of https://real-statistics.com/multivariate-statistics/multivariate-normal-distribution/multivariate-normality-functions/
For the data in this example, r is calculated by =CORREL(A4:A23,B4:B23) in Excel.
Charles
dear professor,
How to run MVN.
The above exmaple does not display running steps.
It shows the formula only.
Should we run step by step?
Yes, you should use a step by step approach. Start as follows:
1. Calculate covariance matrix (D5:E6)
2. Calculate the means (E10 and E11)
3. Calculate Cholesky (I5:J6)
Now, for each random vector that you want to generate
4. Calculate random values from the univariate normal distributions (I10:I11)
5. Calculate a random bivariate normal vector (I15:I16)
You can also generate random vectors by using the Real Statistics array formula in range I19:I20.
Charles
HI, I am teaching Simulation in my class. For Mac using students, I let them use MNORMRAND function for correlated random number generation.
One of my students asked me to help with MNORMRAND. I get his file and I checked, it works fine on my Mac (generating three correlated random numbers). But on his computer, it generates only one random number.
It seems some kind of setting in Excel makes the difference.
Do you have any idea what would make this difference?
Thanks.
Hi Phil,
MNORMRAND is an array function. If you are using Excel 365 then you can simply press Enter to use the function. If you are using any other version of Excel then you can’t simply press Enter. The correct approach is described at
Array Formulas and FunctionsArray Formulas and Functions
Charles
Never mind, I just realized that the test matrix was not positive-definite. Should have checked that first, sorry.
Sorry, I’m getting “#value!” errors in a simple 4-variable test use of MNORMRAND(). I have negative covariances throughout (off-diagonal elements), but it also fails if I make those positive.
Any sense of what I’m doing wrong?
Var-Covar Matrix 50%
Coeff Estimate StdDev Variance A-PDE A-Sample A-Dinner A-Digital
A-PDE 12 3.1 9.61 A-PDE 9.61 -2.8925 -2.465 -2.6525
A-Sample 3 1.4 1.96 A-Sample -2.8925 1.96 -0.5525 -0.74
A-Dinner 1.7 0.5 0.25 A-Dinner -2.465 -0.5525 0.25 -0.3125
A-Digital 2 1 1 A-Digital -2.6525 -0.74 -0.3125 1
Random Vectors
A-PDE #VALUE!
A-Sample #VALUE!
A-Dinner #VALUE!
A-Digital #VALUE!