Basic Approach
The Friedman-Rafsky-Smith-Jain test extends the Friedman-Rafsky test to determine whether a sample comes from a population with a multivariate normal distribution.
Assume that we have a set of k-tuples X of size n with mean vector X̄ and covariance matrix S. Now generate a random set of normally distributed k-tuples Y of size n with mean vector X̄ and covariance matrix S as described at Random Multivariate Normal Vectors. In particular, we can use the Real Statistics function MNORMRAND to accomplish this.
We next carry out the Friedman-Rafsky test on X and Y as described in Friedman-Rafsky Test. If this test is significant, then we have evidence that the X is not normally distributed. The Friedman-Rafsky test assumes that the two samples are independent, which X and Y are not; as a result, this test is somewhat conservative.
Monte Carlo simulation
We can use a Monte Carlo version of the test to address the lack of independence. We conduct this test as follows:
Step 0: Create sample Y as described above and assume that z0 is the test statistic for the Friedman-Rafsky test.
Step 1: Create a sample X1 in the same manner as Y was created above, and suppose that the mean of X1 is X̄1 and the covariance is S1. We now create a random sample Y1 from the multivariate normal distribution N(X̄1, S1) and conduct the Friedman-Rafsky test on X1 and Y1, obtaining the test statistic z1.
Steps 2+: We repeat step 1 multiple times to obtain the test statistics z0, z1, …, zh-1.
Test: We now determine the rank r of z0 among the h test statistics. We can use the RANK.AVG function to obtain r. The null hypothesis that X is normally distributed is rejected if r ≤ hα, where α is the significance level. Alternatively, we can use p-value =r/h.
Worksheet Function
Real Statistics Function: The Real Statistics Resource Pack provides the following array function, where R1 is an n × r array consisting of a random sample of r-tuples of size n.
MNORMTEST(R1, iter) = the p-value for the FRSJ test of multivariate normality for the data in R1. iter = the # of iterations of the Monte Carlo version of the test; if iter = 0 (default), then the non-Monte Carlo version is used.
Example
Example 1: Repeat Example 1 from Multivariate Normality Testing (Mardia) using the FRSJ test for multivariate normality.
We see from Figure 1 that the p-value for the non-Monte Carlo version of the test is .50 (cell L12) using the formula =MNORMTEST(A4:B22). The Monte-Carlo version of the test with 2.000 iterations yields a p-value of .40 (cell L15) using the formula =MNORMTEST(A4:B22,2000).
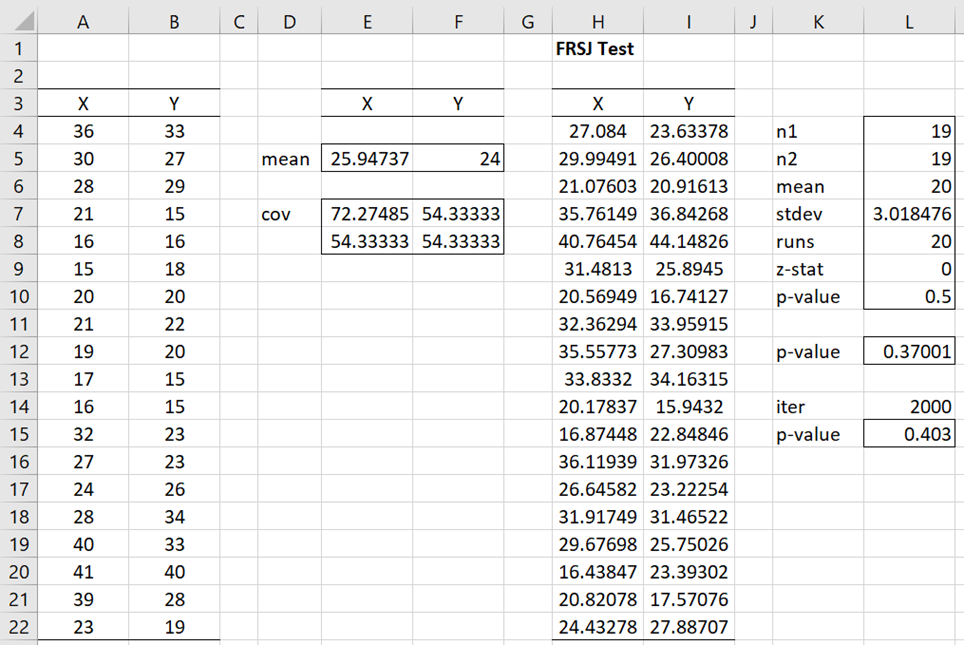
Figure 1 – FRSJ test
Since either of these p-values is larger than alpha = .05, we retain the null hypothesis and consider the sample as coming from a normal distribution.
Note that range K4:L10 of the figure shows how to calculate the non-Monte Carlo version of the test directly from the Friedman-Rafsky test using the array formula =FR_Test(A4:B22, H4:I22, TRUE). Here, range H4:I122 contains the array formula =TRANSPOSE(MNORMRAND(TRANSPOSE(E5:F5), E7:F8)), and range F5:F5 contains the mean vector of the data. The formulas =AVERAGE(A4:A22) and =AVERAGE(B4:B22) are used to calculate the means. Range E7:F8 contains the covariance matrix, using the array formula =COV(A4:B22).
Links
↑ Multivariate normal distribution
Examples Workbook
Click here to download the Excel workbook with the examples described on this webpage.
References
Smith, S. P. and Jain, A. K. (1988) A test to determine the multivariate normality of a data set. IEEE transactions on pattern analysis and machine intelligence, Vol.10. No. 5.