Real Statistics Data Analysis Tool
The Real Statistics Resource Pack provides the Confidence Ellipse data analysis tool which automatically creates a chart of the confidence ellipse (avoiding all the steps described in Confidence Ellipse). To create a 95% confidence interval for Example 1 of Confidence Ellipse, we press Ctrl-m and select the Confidence Interval option from the Multivar tab (or, if using the original user interface, choose the Multivariate Analysis option and then the Confidence Ellipse option from the resulting dialog box). Fill in the dialog box that appears as shown in Figure 1 and click on the OK button.
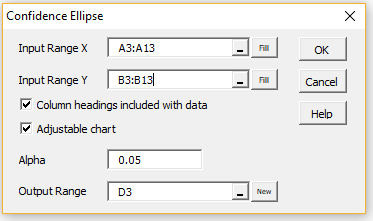
Figure 1– Confidence Ellipse dialog box
Results
The output is shown in Figure 2, although only the first two points from range D18:F39 on the ellipse are displayed. Once again, we need to enlarge the resulting ellipse by using the Change Chart Axes Min/Max data analysis tool as described in Confidence Ellipse. In this case, when the dialog box in Figure 7 of Confidence Ellipse appears, we choose values between 23 and 33 for the x-axis and between 10 and 19 for the y-axis.
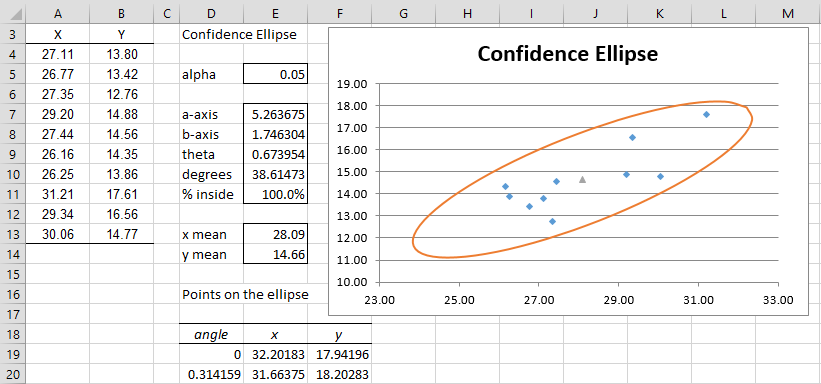
Figure 2 – 95% Confidence ellipse
Finally, note that since we checked the Adjustable chart option in Figure 1, if we change any of the data values in range A4:B13, all the other values in Figure 2 will change automatically and the resulting chart will still be valid (although you may need to resize the ellipse using the Change Chart Axes Min/Max data analysis tool). Similarly, you can change the alpha value in cell E5 and all the other values will change automatically.
Worksheet Function
Real Statistics Function: The Real Statistics Resource Pack provides the following array function where R1 is a column array containing x values and R2 is a column array containing y values that correspond to the x values in R1.
CONF_BNORM(R1, R2, lab, alpha): returns a column array with the lengths of the axes in the 1-alpha confidence ellipse based on the data in R1 and R2, plus theta (the angle at which the ellipse is tilted) and the percentage of data elements inside the ellipse. If lab = TRUE then a column of labels is appended to the output (default FALSE). alpha = the significance level (default .05).
Referring to the data in Figure 2 above, the worksheet array formula =CONF_BNORM(A4:A13,B4:B13,TRUE,.05) will produce the output shown in range D7:E11.
Examples Workbook
Click here to download the Excel workbook with the examples described on this webpage.
Reference
Johnson, R. A., Wichern, D. W. (2007) Applied multivariate statistical analysis. 6th ed. Pearson Prentice-Hall
https://mathematics.foi.hr/Applied%20Multivariate%20Statistical%20Analysis%20by%20Johnson%20and%20Wichern.pdf
Thank you Charles for this good article.
Can we calculate an ellipsoid in n-dimension, instead of 2D?
Hello John,
Yes, you can calculate an ellipsoid in n dimensions. I limited myself to 2D since my main goal was to provide the chart/graph.
Charles
Dear Charles,
first of all, thank you so much for this wonderderful tool!
I found an issue that I would like to report to you.
I got an error when trying to calculate the confidence ellipse.
As far as I can understand, it is because in the following formula:
=CONF_BNORM(B2:B23;C2:C23;’Vero’;G6)
Vero is written between single quotes.
If I manually delet those, the formula works but then only the output of the formula appears (i.e., the results in range D7:E11 of Figure 2).
Do you have any suggestion on how to solve it?
Thank you very much.
Best regards.
Hello Giacomo,
I am aware of this problem and expect to issue a new release of the Real Statistics software in the next few days which will resolve this problem.
When you say that only the output of the formula appears, does this mean that the graph is not displayed?
Charles
Dear Charles,
yes, exactly. If I copy the function in another cell and remove the single quotes, the only outputs that appear are a-axis, b-axis, theta, degrees, % inside.
Best regards
Sorry about this problem. I hope to have a new release out in the next few days that will correct this.
Charles
Thank you very much.
Best regards.
Dear Charles,
I’m having a similar issue to Zeyu. I’ve made sure to change the value you suggested to change in that solution, but the results from the spreadsheet and the statistical tool differ slightly one from the other.
Here’s a link with both plots of my data: https://imgur.com/a/yiP17jT . On the left is the one from the statistical plug in in excel and the right is the spreadsheet data. As you can see clearly in two points, the top left red, and bottom left black, the ellipses do not quite match up one to another. Do you have a solution for this error?
Cheers,
João
João,
You have two ellipses on the left and two on the right. Are you comparing the black ellipses and separately the red ellipses?
Can you email me a file with your data so that I can try to figure out what is going on?
Charles
Dear Charles,
Thank you for your website. I have a problem. I find that the Data in the two pages of “confidence ellipse” and “Confidence Ellipse Analysis Tool” are the same, but the results are different. One of the points in “confidence ellipse” is outside the ellipse, while the points in the package of Real Statistics Data Analysis Tool are all inside the ellipse. I don’t know why.
Best wishes
Zeyu Zhang
Dear Zeyu,
There is a difference between the two pages. On “Confidence Ellipse Analysis Tool” the alpha value is set to .05 (cell E5) which is equivalent to a 95% confidence ellipse. It turns out that in this case, all the data points are inside the ellipse (cell E11).
On “Confidence Interval” the percentage of elements inside the ellipse was set to 67.5% (cell H8). If you reset this to 95% you should get the same result as shown on the other page. Similarly, you can set .05 on “Confidence Ellipse Analysis Tool” to 32.5% you will get the same results as shown on “Confidence Interval”.
Charles