Real Statistics Functions
The Real Statistics Resource Pack provides the following array functions associated with MANOVA for the range R1 with data in standard form (without column headings).
MANOVA_T(R1) = T
MANOVA_H(R1) = H
MANOVA_E(R1) = E
Wilk’s Lambda Test
In addition, the resource pack provides the following functions associated with Wilk’s Lambda Test:
MANOVA_WilksLambda(R1) = Λ
MANOVA_Wilksdf1(R1) = df1
MANOVA_Wilksdf2(R1) = df2
MANOVA_WilksF(R1) = F
MANOVA_WilksTest(R1) = p-value
For example, MANOVA_WilksLambda(A4:D35) = 0.4894 for the data in Example 1 of Manova Basic Concepts.
Hotelling-Lawley Trace Test
It also provides the following functions associated with the Hotelling-Lawley Trace Test:
MANOVA_HotelTrace(R1) =
MANOVA_Hoteldf1(R1) = df1
MANOVA_Hoteldf2(R1) = df2
MANOVA_HotelF(R1) = F
MANOVA_HotelTest(R1) = p-value
Pillai-Barlett Trace Test
It also provides the following functions associated with the Pillai-Bartlett Trace Test:
MANOVA_PillaiTrace(R1) = V
MANOVA_Pillaidf1(R1) = df1
MANOVA_Pillaidf2(R1) = df2
MANOVA_PillaiF(R1) = F
MANOVA_PillaiTest(R1) = p-value
More Array Functions
The resource pack also supplies the following array functions each of which outputs a 5 × 1 array with the appropriate Manova statistic, df1, df2, F statistic and appropriate p-value.
MANOVA_Wilks(R1)
MANOVA_Hotel(R1)
MANOVA_Pillai(R1)
Roy’s Largest Root
Finally, the resource pack contains the following functions regarding Roy’s Largest Root:
MANOVA_RoyRoot(R1, b) = largest eigenvalue λp of HE-1 if b = TRUE (default) and = if b = FALSE
Real Statistics Data Analysis Tool
The Real Statistics Resource Pack provides the MANOVA data analysis tool. This tool can be employed for the analysis of Example 1 of Manova Basic Concepts as follows:
Step 1: Press Ctrl-m to display the main menu
Step 2: Choose the MANOVA data analysis option from the Multivar tab
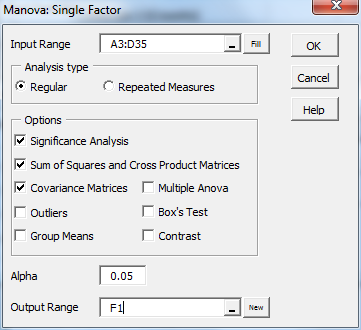
Step 3: The dialog box shown in Figure 1 will now appear
Figure 1 – Single Factor Manova dialog box
Step 4: Insert the Input Range (in standard format). For Example 1 of Manova Basic Concepts, insert A3:D35 in the Input Range (using the data from Figure 1 of Manova Basic Concepts, including the column headings). Click on the Regular analysis type and all the desired options (for now we select the first three options) and click on the OK button.
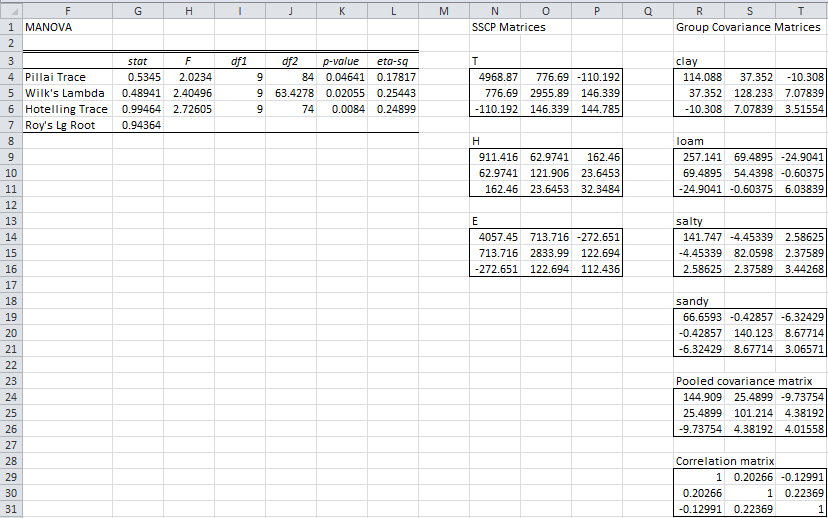
Step 5: The output shown in Figure 2 appears.
Figure 2 – Manova analysis for Example 1
The output from the various tests (range F6:L9) is the same as we obtained in Figure 6, 7 and 8 of Manova Basic Concepts. The results for T, H and E (range N5:P18) are the same as we obtained in Figure 5 of Manova Basic Concepts.
Pooled Covariance Matrix
The covariance matrices for each group as well as the pooled covariance matrix and total correlation matrix are shown in range R5:T31. E.g. the covariance matrix for the clay group (range R4:T6) can be computed by the Real Statistics formula COV(B28:D35).
Definition 1: If S1, S2, …, Sm are k × k group covariance matrices where each group g has ng elements, then the pooled covariance matrix S is
For Example 1 of Manova Basic Concepts, the pooled group matrix is shown in range R24:T26 of Figure 2. It can also be computed by the array formula R4:T6+R9:T11+R14:T16+R19:T121.
Observation: The total SSCP can be computed as the (total) covariance matrix of the sample times dfT = n – 1. Similarly, the error SSCP can be computed by the pooled covariance matrix times dfE = n – m, i.e.
T = CovT ∙ (n – 1)
E = CovPooled ∙ (n – m)
In fact, multiplying range R24:T26 by n – m = 32 – 4 = 28 does indeed yield the E matrix as shown in range L14:N16 of Figure 5 of Manova Basic Concepts.
Observation: If we had also checked the Group Means option in the dialog box in Figure 1, the output shown in Figure 2 of Manova Basic Concepts would also be included in the output shown in Figure 2.
More Real Statistics Functions
The Real Statistics Resource Pack provides the following array functions where range R1 contains data in standard form (with or without column headings) and s is a string which presumably specifies a group (in the first column of R1):
ExtractRows(R1, s, b) = the array which contains all the elements in range R1 for the group labeled s. If b is set to True, the first row of R1 is included in the output (presumably column headings) even if there is no match. If b is omitted it defaults to True.
ExtractCov(R1, s) = the covariance matrix for the group labeled s, based on the data in range R1. If s is the empty string “” or is omitted then the pooled covariance matrix of R1 is returned.
Note that when calculating the pooled covariance matrix using ExtractCov(R1) where R1 contains column headings, it is important that the first cell in R1 be empty (otherwise this will be interpreted as representing another group).
The Real Statistics Resource Pack also provides the following array function where range R1 contains data in standard form (with column headings) and s is a string that specifies a column heading (i.e. an entry in the first row of R1), which selects one of the dependent variables.
ExtractCol(R1, s) = an array that consists of all the data in R1 for the dependent variable identified by s, now organized by columns with one column for each group. You should highlight a range with g columns where g = the number of groups.
Observations
We can use the ExtractCov function to calculate the group and pooled covariance matrices displayed in Figure 2. E.g. the covariance matrix for the clay group (range R4:T6) can be computed by ExtractCov(A3:D35,”clay”) or ExtractCov(A4:D35,”clay”). The pooled covariance matrix (range R24:T26) can be computed by ExtractCov(A3:D35) or ExtractCov(A4:D35).
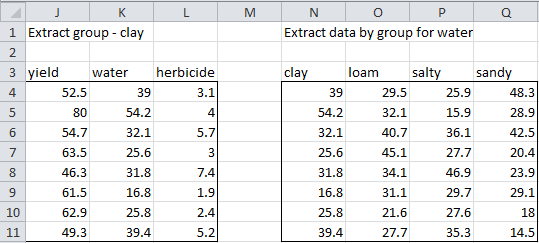
We can use ExtractRows to extract only those data elements in a particular group. Referring to the data in Figure 1 of Manova Basic Concepts, we can extract the data for the clay group using the formula ExtractRows(A3:D35,”clay”) as shown on the left side of Figure 3. Clearly, the covariance matrix for the clay group can also be calculated by COV(J4:L11).
Figure 3 – Use of ExtractRows and ExtractCol functions
We can use ExtractCol to extract only those data elements for a particular independent variable, organized by group with one group per column. Referring again to the data in Figure 1 of Manova Basic Concepts, we can extract the data for water using the formula ExtractCol(A3:D35,”water”) as shown on the right side of Figure 3.
Effect Size
Referring to Figure 2, we discuss the eta-squared effect size in Manova Effect Size and the correlation matrix in Manova Assumptions.
More Data Analysis Tool Options
We also describe the other MANOVA data analysis tool options (as shown in Figure 1) in Manova Follow-up Anova and Manova Follow-up Contrasts.
Examples Workbook
Click here to download the Excel workbook with the examples described on this webpage.
References
Johnson, R. A., Wichern, D. W. (2007) Applied multivariate statistical analysis. 6th Ed. Pearson
https://mathematics.foi.hr/Applied%20Multivariate%20Statistical%20Analysis%20by%20Johnson%20and%20Wichern.pdf
Rencher, A.C., Christensen, W. F. (2012) Methods of multivariate analysis (3nd Ed). Wiley


Hi, I imputed my data in standard form and tried to compute the anova. The group means show up but all the values in the multiple anova and stats tests show up as errors (#NAME? AND #DIV/0!) . Please helppp!
Hello Jonathan,
What do you see when you enter the formula =VER() in any cell?
Charles
I followed your steps accurately. But while using Manova it keeps on having errors with all the hashtags. What should i do? Is it my laptop’s problems? Fyi, the solver add in is checked.
Hello,
If you email me an Excel file with your data and test results, I will try to figure out what is happening.
Charles
I have the same problem, can I do something to fix this?
Hello Tamara,
I don’t which problem you are having, but If you email me an Excel file with your data and test results, I will try to figure out what is happening.
Charles
Hi Charles,
It could be a typo:
“If we had also checked the Group Means option in Figure 9 of Manova Basic Concepts, the output shown in Figure 3 of Manova Basic Concepts would also be displayed in Figure 2.”
should be
“If we had also checked the Group Means option in Figure 1, the output shown in Figure 3 of Manova Basic Concepts would also be displayed in Figure 2.” ?
Thanks for your great work!
Federico
Dear Federico,
Thank you for bringing this to my attention. I have corrected this error, although my correction is slightly different from the version that you wrote. Please let me know whether you agree with this correction.
I appreciate your help in improving the accuracy of the website.
Charles
Yes, I agree! Rightly you have also replaced “Figure 3” with “Figure 2”.. Now it’s all very clear 🙂
Federico
Federico,
Thanks again for your help.
Charles
I am trying to analyze a data set that has a list of project managers and options chosen by each of them. Each project manager can chose an option amongst 4 options. Work experience of each project is known. I am trying to validate if any relationship exists between work experience and options chosen. Can someone suggest a statistical method to analyze this. Example of the data I am trying to analyze: Managers of experience between 0-5 yrs: 20 chose Option 1, 12 chose option 2, 7 chose option 3, 3 chose option 4; PMs with experience 5-10 yrs: 12 Chose option 1, 15 chose option 2, 14 chose option 3, 7 chose option 4; PMs with > 10 yrs experience: 6 chose option 1, 9 chose option 2, 12 chose option 3, 11 chose option 4.
Pavan,
I only partially understand the scenario that you are describing, but it looks like a fit for chi-square test of independence.
Charles
I can’t manipulate my data in paST. It keeps saying “must select four columns” yet it won’t accept my data. Helpppppppppppppppppp meeeeeeeeeeeeeeeeeeeeeeeeeeemeeeeeeehehehe
Jeanny,
If you send me an Excel file with your data, I will try to figure out what is happening. You can find my email address at Contact Us.
Charles
Hi,
I am trying to do a MANOVA using the real stats add-in on Excel 2007. I have set up my data with my dependent variables in the columns and independent variables as the rows, but I keep getting the error message “compile error in hidden module: multivariate” and I’m not sure what this means or how to fix it. Can you please advise me on how to proceed?
Thank you!
Elyssa,
This is a message that means that the Real Statistics software hasn’t been installed correctly. If you are able to use other Real Statistics capabilities, then you have likely performed the Real Statistics installation as described, but the Real Statistics software is not able to find some Excel capabilities that it needs. You may be able to fix this by making sure that you have installed all the latest Excel 2007 service packs.
If you are also not able to use any of the other Real Statistics capabilities, especially the function =VER(), then the likely cause is that you need to reinstall the software as described on the Real Statistics Resource Pack for Excel 2007. You need to make sure that you follow the Installation instructions after downloading the software.
Charles
How can I do a two-way MANOVA?
Sabeena,
The Real Statistics Resource Pack doesn’t support two-way MANOVA yet. This support is coming soon.
Charles
I am trying to work out how to set up my spreadsheet in order to use the MANOVA tool. I am assessing the effect of 4 variables, gestational age in weeks, corrected age in weeks, postnatal age in weeks and weight in kilograms, on the factors that make up cardiac output, where cardiac output is a factor of end diastolic volume in mls, end systolic volume in mls and heart rate in beats per minute. For each of 78 subjects I therefore have a numerical value for each of the above categories. Can you help?
Anna,
Format the worksheet as in Figure 1 of the webpage https://real-statistics.com/multivariate-statistics/multivariate-analysis-of-variance-manova/manova-basic-concepts/ where the dependent vector are represented by the columns of the worksheet (this I called standard format). Then you can press Ctrl-m and use the Manova data analysis tool from the Real Statistics Resource Pack.
Charles
I have compile error in hidden module, how to correct this error.
In depends on the details, but one common reason for this problem is that Solver has not been installed. You can find this out by pressing Alt-TI. You should see both RealStats and Solver on the list of Excel add-ins with check marks next to them.
Charles
Sir
I can’t find the MANOVA data analysis tool, I am using 2.12 addin.
Colin
Colin,
It is called Single Factor Manova and is the second to last choice in the menu.
Charles
Second to last is “Resampling”
Ah I did not realise there was another layer. Found!