Worksheet Functions
Real Statistics Functions: The Real Statistics Resource Pack contains the functions referenced in Permutational MANOVA Example. Here, R1 contains the MANOVA data (without row or column headings) and grps = the number of groups.
PseudoF(R1, grps) = the pseudo F statistic
PERMANOVA(R1, grps, iter) = the p-value for Permutational MANOVA based on iter many iterations (default 1,000).
Observations
Currently, the Real Statistics Resource Pack only supports the Euclidean distance function.
For Example 1 of Permutational MANOVA Example we have m = 4 groups, each with n = 4 sample elements, each of which is a vector with k = 3 elements. This means that we have N = mn = 16 rows, and so there are N! possible permutations, which is a very large number. However, many of these are redundant since the order of the rows within a group doesn’t change the F statistic and the order of the groups also doesn’t change the F statistic.
In fact, the number of unique permutations is N!/[m!(n!)2]. For Example 1, this 16!/[4!(4!)2], which is still a large number (about 1.5 billion), and so random permutations are necessary.
If instead, say we had m = 3 and n = 4, then we would have 12!/[3!(4!)2] =138,600 unique permutations, and so it may be possible to calculate an exact p-value. Since this is rare, we will use the Monte-Carlo simulation approach described above. With very small samples, e.g. where m = 2 and n = 3, we might be able to calculate an exact p-value, but it won’t usually be of much use to us. In this case, there are 6!/[2!(3!)2] =10 unique permutations, and so the smallest possible p-value is .10. Thus, we won’t be able to obtain a significant result when alpha = .05.
Data Analysis Tool
Real Statistics Data Analysis Tool: The Real Statistics Permutational MANOVA data analysis tool can also be used to perform the procedure described above. For Example 1 of Permutational MANOVA Example, this is done by pressing Ctrl-m and choosing the Permutational MANOVA option from the Multvar tab. Next, fill in the dialog box that appears as shown in Figure 1.
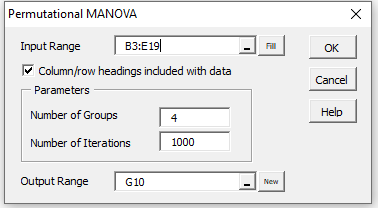
Figure 1 – Permutational MANOVA dialog box
Upon clicking on the OK button, the output shown in the lower part of Figure 2 is displayed.
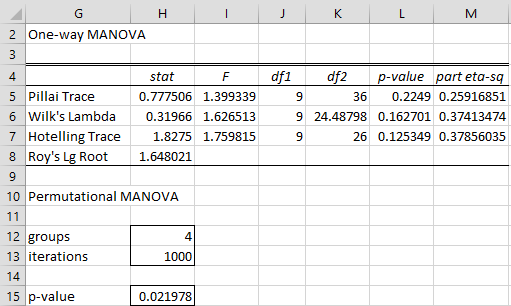
Figure 2 – MANOVA output
For this example, the results from Permutational MANOVA are quite different from those obtained from the One-way MANOVA data analysis tool (shown in the upper part of Figure 2).
Example
Example 1: Compare the output from the One Factor ANOVA data analysis tool with that from the Permutational MANOVA data analysis tool on the yield data from Figure 4 (replicated on the left side of Figure 3).
Figure 3 contains the ANOVA output (using the standard format option) along with the output from the Permutational MANOVA data analysis tool. This time the results are quite similar (p-value = .043956 from Permutational MANOVA versus .039666 from ANOVA).
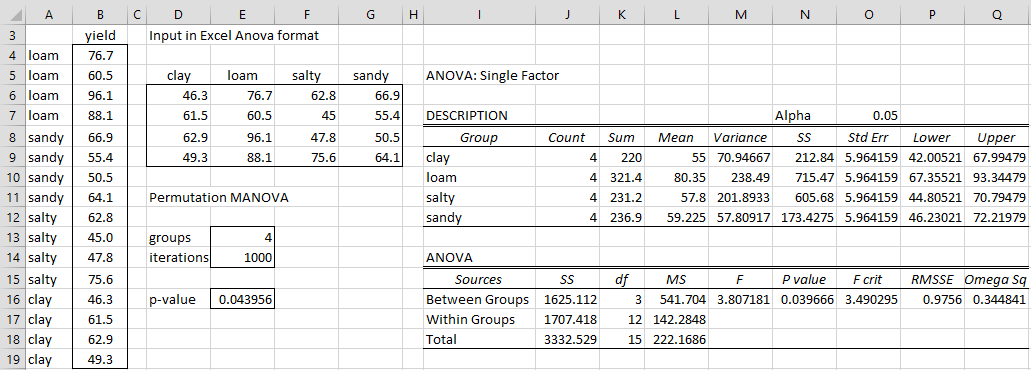
Figure 3 – ANOVA output
Examples Workbook
Click here to download the Excel workbook with the examples described on this webpage.
Reference
Anderson, M. J. (2005) PERMANOVA
https://pdfs.semanticscholar.org/4d0c/430f6129b427e48fb407e59ac79ee29b4cae.pdf
Great tool, but it seems that it works only for balanced datasets, same number of samples in each group. Or am I missing something?
Hi Sal,
I believe that you are correct. I think that I only support balanced designs.
Apparently, there are approaches that can be used for unbalanced designs. See, for example,
https://learninghub.primer-e.com/books/permanova-for-primer-guide-to-software-and-statistical-methods/page/133-unbalanced-designs
Charles
Hi Charles,
Can PERMANOVA work on a mixed design – one between (two groups) by one within (two time points)? This would be for proteomics/microarray data (e.g. almost 1400 proteins), so in addition to main effects for group, time point, and interaction generally, I am wondering about main and interaction effects specific to each protein, and of course, correction for multiple comparisons. Appreciate your help!
Best,
Shawn
Hi Shawn,
My understanding is that PERMANOVA can also be used for mixed models. This is explained in the Anderson article referenced on this webpage.
Charles
Hello Charles,
I wish to thank you for your incredible work!
Neverthless, I have an issue: I can’t find a way to conduct a PERMANOVA with pairwise comparisons to determine which groups are significantly different from each other. Could you help me?
Best regards,
Pablo
Hello Pablo,
Perhaps you could use one of the usual MANOVA follow-up tests, assuming the assumptions are satisfied.
Charles
Hi Charles,
Thanks for the amazing contribution. However, when I perform PERMANOVA, the p-value changes over time. I am not sure when the calculation is finished and which p-value is the stable one to consider. Also, it changes when I double-click on the p-value.
Hello Shihab,
Glad that you like Real Statistics.
PERMANOVA uses random shuffles of the data (as explained in PERMANOVA Example), and so the results will vary and can change. You can Copy the results and Paste Values to make the results stable.
Many statistical techniques use this approach.
Charles
Thank you for your kind reply. I would be grateful if you could provide me with some additional advice regarding the p-values I am obtaining. They appear to vary each time, presumably due to randomness. For instance, I have observed p-values such as 0.003, 0.004, 0.007, 0.0109, and 0.0138. I am currently facing some confusion about which p-value to consider. For instance, if I were to choose 0.003, it would be highly significant, but opting for a p-value of 0.0139 would render it significant but not highly so.
Usually when uing a statistical technique based on random number generation (Monte Carlo simulation approaches), the p-values vary but not too much. If the there is too much variation, then you need to increase the number of iterations. This should reduce the variation.
Charles
It is clear to me now. Thank you so much for your further assistance.
Hey Charles,
What a wonderful tool you have developed! It helped me a lot in the past with plotting confidence ellipses.
However, I seem to be struggling with the PERMANOVA. I keep getting the following error with my dataset: “All groups must have the same number of elements in the input range”
Could you possibly help me with the error?
Thanks in advance!
Rick
Rick,
Thank you for your kind words.
If you email me an Excel spreadsheet with your data, I will try to figure out why you are getting this error.
Charles
Hi Charles,
Thank you for your reply. I just sent you my Excel file as requested.
Jose
Hi Charles,
The function PERMANOVA does not work on my side when you have 3 groups, and neither when you have 5 groups.
Could you check on your side?
Any help will be MUCH appreciated.
Hello Jose,
Can you send me an Excel file with this data where PERMANOVA doesn’t work so that I can try to figure out what is going wrong?
Charles