Example
Example 1: Apply Permutational MANOVA to Example 1 of MANOVA Basic Concepts based on the data in Figure 1.
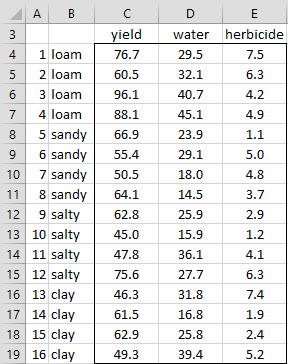
Figure 1 – Data for Example 1
We now show how to calculate the pseudo-F statistic for the data in Figure 1. See Figure 2.
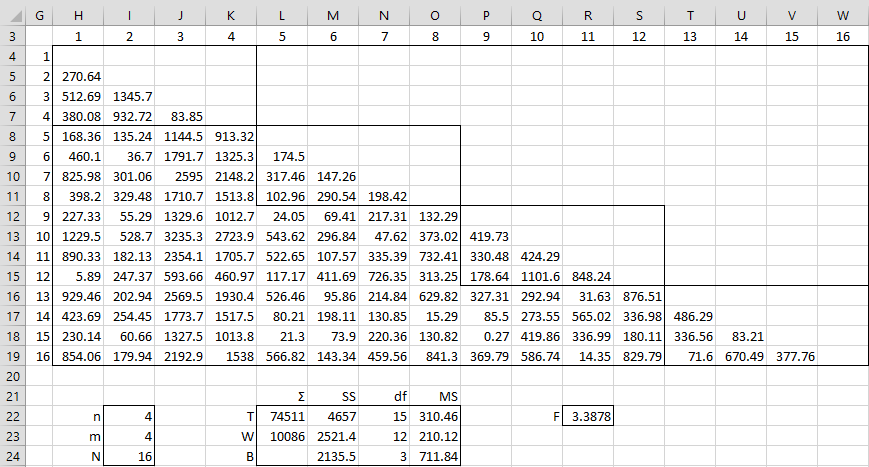
Figure 2 – Calculation of pseudo-F
Pairwise Distances
The entries in range H4:W19 contain the pairwise distance squared values based on the Euclidean distance formula. This range is filled in by inserting the following formula in cell H4, highlighting range H4:W19, and then pressing Ctrl-R and Ctrl-D.
=IF(H$3>=$G4,””,(INDEX($C$4:$E$19,$G4,1)-INDEX($C$4:$E$19,H$3,1))^2+(INDEX($C$4:$E$19,$G4,2)-INDEX($C$4:$E$19,H$3,2))^2+(INDEX($C$4:$E$19,$G4,3)-INDEX($C$4:$E$19,H$3,3))^2)
Cell L22 contains the formula =SUM(H4:W19) and cell L23 contains the formula =SUM(H4:K7,L8:O11,P12:S15,T16:W19). Cells M22, M23 and M24 contain the formulas =L22/I24, =L23/I22 and =M22-M23. Cells N22, N23 and N24 contain =I24-1, =I24-I23 and =I23-1. Finally, cells O22, O23 and O24 contain the formulas =M22/N22, =M23/N23 and =M24/N24. In addition, the pseudo-F statistic in cell R22 is calculated by the formula =O24/O23.
Iterations
By way of illustration, Figure 3 shows how to perform the Permutational MANOVA procedure using only two iterations.
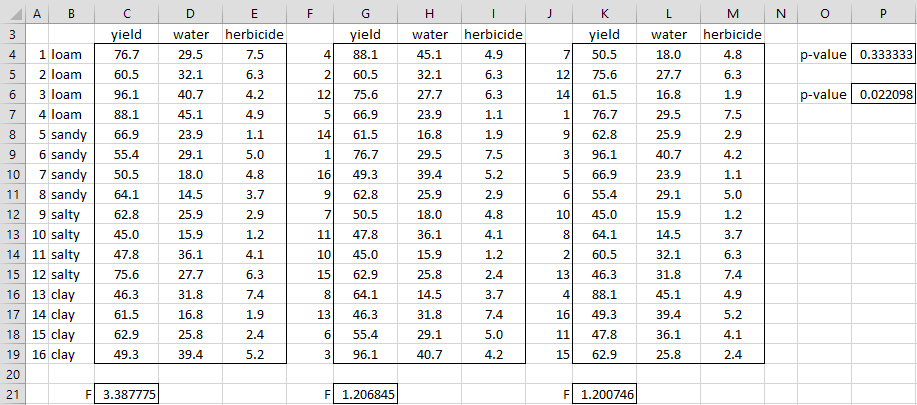
Figure 3 – Permutational MANOVA
The first iteration of data, shown in range G4:I19, is obtained by randomly shuffling the order of the rows of the original data. This order is specified in column F using the array formula =SHUFFLE(A4:A19). The first row in the permutation corresponds to the 4th row of the original data (cell F4). Thus, range G4:I4 should have the values in range C7:E7. This is done by placing the array formula =INDEX(C4:C19,$F4:$F19) in range G4:G19 and pressing Ctrl-Shft-Enter, highlighting the range G4:I19 and pressing Ctrl-R. The pseudo-F statistic can then be calculated as for the original data or by placing the formula =PseudoF(G4:I19,4) in cell G21 (see Real Statistics Support for Permutational MANOVA for the definition of the PseudoF function).
The pseudo-F statistic for the original data is 3.387775. Since neither of the permutations results in a higher pseudo F value, the estimated p-value is 1/3 as shown in cell P4.
Results
Using 1,000 iterations, clearly a more credible value, we obtained a p-value = .022098 (cell P6). This can be obtained via the formula =PERMANOVA(C4:E19,4), where the PERMANOVA function is as described in Real Statistics Support for Permutational MANOVA.
Examples Workbook
Click here to download the Excel workbook with the examples described on this webpage.
Reference
Anderson, M. J. (2005) PERMANOVA
https://pdfs.semanticscholar.org/4d0c/430f6129b427e48fb407e59ac79ee29b4cae.pdf