Univariate case
One-way ANOVA investigates the effects of a categorical variable (the groups, i.e. independent variables) on a continuous outcome (the dependent variable). In one-way ANOVA, we have m random variables x1, …, xm (also called groups or treatments). For each group, we have a sample, where we denote the jth group sample as {, …,
}. Group j is said to have nj subjects in its sample. We also define
.
Our objective is to test the null hypothesis H0: μ1 = μ2 = ⋯ = μm.
We use the following definitions for the total (T), between groups (B) and within groups (W) sum of squares (SS), degrees of freedom (df) and mean square (MS):
The test statistic F is defined as follows and has an F distribution with dfB, dfW degrees of freedom:
We reject the null hypothesis if F > Fcrit.
Multivariate case
MANOVA also investigates the effects of a categorical variable (the groups, i.e. independent variables) on a continuous outcome, but in this case, the outcome is represented by a vector of dependent variables.
We could simply perform multiple ANOVA’s, one for each dependent variable, but this would have two disadvantages: it would introduce additional experiment-wise error and it would not account for the correlations between the dependent variables. It is, therefore, possible that MANOVA shows a significant difference between the means while the individual ANOVA do not.
Also MANOVA can be used in place of ANOVA with repeated measures. This has the advantage that MANOVA doesn’t require sphericity. With MANOVA, you treat the repeated levels as dependent variables.
Model Definition
Definition 1: In One-way MANOVA, we have m random vectors X1, …, Xm (representing groups or treatments). Each Xj is a k × 1 column vector of form
where each xjp is a random variable.
For each random vector Xj we collect a sample {, …,
} of size nj. We also define
. Each sample Xij is a k × 1 vector of form
![]() where each xijp is a data element (not a random variable), where index i refers to the subject in the experiment (1 ≤ i ≤ nj), index j refers to the group (1 ≤ j ≤ m) and index p refers to the position (i.e. dependent variable) within the random vector (1 ≤ p ≤ k).
where each xijp is a data element (not a random variable), where index i refers to the subject in the experiment (1 ≤ i ≤ nj), index j refers to the group (1 ≤ j ≤ m) and index p refers to the position (i.e. dependent variable) within the random vector (1 ≤ p ≤ k).
Our objective is to test the null hypothesis H0: μ1 = μ2 = ⋯ = μm where the μj are vectors
and so the null hypothesis is equivalent to H0: μ1p = μ2p = ⋯ = μmp for all p such that 1 ≤ p ≤ k. The alternative hypothesis is, therefore, H1: μr ≠ μj for some r, j such that 1 ≤ r, j ≤ m, or equivalently, μrp ≠ μjp for some r, j, p such that 1 ≤ r, j ≤ m and 1 ≤ p ≤ k.
Now we define the various means as in the univariate case, except that now these means become k × 1 vectors. The total (or grand) mean vector is the column vector
The sample group mean vector for group j is a column vector
Example
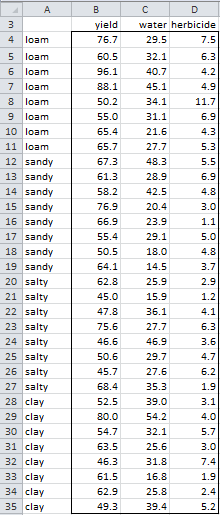
Example 1: A new type of corn seed has been developed and a team of agronomists wanted to determine whether there was a significant difference between the types of soils that they are planted in (loam, sandy, salty, clay) based on the yield of the crop, amount of water required and amount of herbicide needed. Eight fields of each type were chosen for the analysis. Based on the data in Figure 1, determine whether there is a significant difference between the results for each type of soil condition.
Figure 1 – Data for Example 1 in standard form
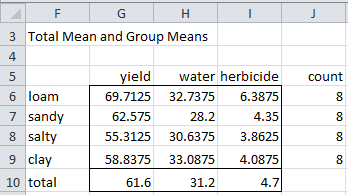
We also calculate the total mean vector and group vectors (expressed as row vectors) in Figure 2:
Figure 2 – Total mean and group mean vectors
Here, for example, the total mean for yield (cell G10) is calculated by the formula =AVERAGE(B4:B35) . The other total mean values are calculated by highlighting range G10:I10 and pressing Ctrl-R.
The loam group mean for yield (cell G6) is calculated by the formula
=AVERAGEIF($A$4:$A$35,$F6,B$4:B$35)
The other group mean values are calculated by highlighting range G6:I9 and pressing Ctrl-R and Ctrl-D.
Charts
It can be useful to create a chart with the group means shown in Figure 2. To do this, highlight the range F5:I5 and then select Insert > Charts|Line and then Design > Data|Switch Row/Column. The result is shown on the left side of Figure 3.
Figure 3 – Chart of group mean vectors
The group mean vectors all look fairly similar (although as we will soon see there are significant differences). It seems that the loam and sandy mean group vectors are very similar and a bit different from the salty and clay group mean vectors which are also very similar.
These distinctions are even more evident when we look at the group means minus the total mean (shown in Figure 4 below). We can create a chart of the group means minus the total mean by highlighting F14:I18 (from Figure 4) and selecting Insert > Charts|Line and then Design > Data|Switch Row/Column. The result is shown on the right side of Figure 3.
Total Cross Products
Definition 2: Using the terminology from Definition 1, we define the following total cross products for p and q.
which is the total sum of squares (as in ANOVA) and measures the total variation in the pth dependent variable. When p ≠ q, we have the total cross-product terms, which measure the dependence between the pth and qth variables across all observations.
The multivariate equivalent of the total sum of squares is the total sum of squares and cross products, i.e. the SSCPT matrix, which is abbreviated a T, and is defined as
Note that the diagonal terms are SS1, …, SSk. An alternative way of expressing T is as follows:
If the sample data is expressed as a range R1 in the format shown in Figure 1 (what we will henceforth call the standard format) and R2 is the total mean row vector, then T can be calculated by
=MMULT(TRANSPOSE(R1–R2),R1–R2)
which for Example 1 is the array formula
=MMULT(TRANSPOSE(B4:D35-G10:I10),B4:D35-G10:I10)
The sample covariance matrix plays the role of MST since MST = SSCPT / dfT where the degrees of freedom is given by dfT = n – 1. In fact (using the Real Statistics array formula COV or COVP), we can calculate T as follows:
T = COV(R1)*(n–1) = COVP(R1)*n
Thus for Example 1, T can be calculated by the array formula
=COVP(B4:D35)*COUNT(B4:B35)
Hypothesis Cross Products
Definition 3: We define the hypothesis cross products for p and q as follows:
We define the hypothesis sum of squares and cross products as the matrix H where
Alternatively, H can be defined as
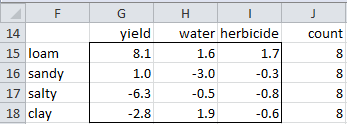
To calculate H for Example 1, we first use the data in Figure 1 and 2 to derive the table in Figure 4, consisting of the differences between the group means and total means.
Figure 4 – Group mean vectors minus total mean vector
The value for loam × yield (cell G15) is calculated by the formula =G6-G$10. To obtain the other mean differences, highlight the range G15:I18 and press Ctrl-R and Ctrl-D. To obtain the count for loam enter the formula =COUNTIF($A$4:$A$35,F15) in cell J15. The counts for the other groups are obtained by highlighting the range J15:J18 and pressing Ctrl-D.
If the sample data is expressed as a range R1 in the standard format shown in Figure 1 and R2 is the column vector with the counts for each of the groups (as in range J15:J18 of Figure 4), then H can be calculated by
=MMULT(TRANSPOSE(R1),R1*R2)
which for Example 1 is the array formula
=MMULT(TRANSPOSE(G15:I18),G15:I18*J15:J18)
Error Cross Products
Definition 4: We define the error (or residual) cross products for p and q as follows:
We define the error (or residual) sum of squares and cross products as the matrix E where
Alternatively, E can be defined as
Properties
Property 1: T = H + E
Also for any p and q, CPT = CPH + CPE
Proof:
Sum of squares and cross product (SSCP)
The three sum of squares and cross product (SSCP) terms play the role of the SS in ANOVA. The degrees of freedom terms are dfT = n – 1, dfH = m – 1, dfE = n – m. As usual dfT = dfH + dfE. How these terms are used to create the appropriate F test is more complicated than in ANOVA. We will look at this shortly.
Example 1 (continued): Calculate T, H and E.
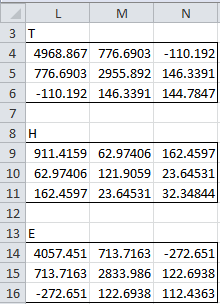
Using the formulas described above, we can calculate T and H, as shown in Figure 5. Using Property 1, we have that E = T – H = L4:N6–L9:N11.
Figure 5 – SSCP matrices for Example 1
Observation: We would now like to create an F-test by dividing H by E, as was done for ANOVA. The equivalent in the matrix world is to look at the matrix HE–1. We then reject the null hypothesis if H is “large” compared to E. For MANOVA we have the following four different measures which can be used to determine whether H is large compared to E.
Test Statistics
Definition 5:
Wilk’s Lambda: Λ =
H is large compared to E when the numerator of the above is small compared to the denominator. Thus we reject the null hypothesis when Wilk’s Lambda is close to zero. By Property 1, Λ = |E| / |T|.
Hotelling-Lawley Trace: = trace(HE-1)
H is large compared to E when Hotelling-Lawley Trace is large. In this case, we reject the null hypothesis.
Pillai-Bartlett Trace: V = trace(H(H+E)-1)
If H is large compared to E then this statistic will be large. Thus, we reject the null hypothesis when this value is large.
Roy’s Largest Root: Θ = largest eigenvalue of HE-1
Again we reject the null hypothesis if this statistic is large. The following alternative version of Roy’s Largest Root is also sometimes used:
where λp largest eigenvalue of HE-1
See Eigenvalues and Eigenvectors for the definition of eigenvalue.
Wilk’s Lambda Property
Property 2: Λ =
Proof: Note that E and H are both symmetric matrices, and so E-1 is also symmetric. This means that HE-1 = E-1H. But then E(I+HE-1) = E(I + E-1H) = EI + EE-1H = E + H. By Property 2 of Determinants and Simultaneous Linear Equations, the determinant of a product of two square matrices is equal to the product of the determinants of each matrix, and so |E| ∙ |I + HE-1|=|E(I+HE-1)|= |E + H|. Thus
Example 1 (continued) test statistics: Calculate the above statistics for Example 1.
Figure 6 – Test statistics for Example 1
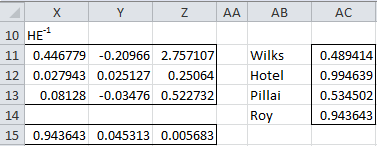
Referring also to Figure 5, HE-1 (range X4:Z6) is calculated by the array formula =MMULT(L9:N11,MINVERSE(L14:N16)) and HT-1 (range AB4:AD6) is calculated by the array formula =MMULT(L9:N11,MINVERSE(L4:N6)). Thus Wilk’s Lambda can be calculated by the formula =MDETERM(L14:N16)/MDETERM(L4:N6), Hotelling-Lawley Trace by =TRACE(X4:Z6) and Pillai-Bartlett Trace by =TRACE(AB4:AD6).
We will calculate Roy’s Largest Root in a moment.
Using Eigenvalues
Property 3: We can calculate the above metrics from the eigenvalues λ1, …, λk of HE-1 as follows:
Wilk’s Lambda: Λ =
Hotelling-Lawley Trace:
Pillai-Bartlett Trace: V =
Proof: By Property 5 of Eigenvalues and Eigenvectors, the eigenvalues of I + HE-1 are 1+λ1, …, 1+λk, and so by Property 1a of Eigenvalues and Eigenvectors, |I + HE-1| = . It now follows by Property 2 that
![]()
By Property 1b of Eigenvalues and Eigenvectors, for any matrix A, trace A = sum of its eigenvalues, and so = trace(HE-1) =
Finally, H + E = E + H = IE + HI = IE + H(E–1E) = IE + (HE-1)E = (I + HE-1)E.
Thus, H(H + E)-1 = H((I + HE-1)E)-1 = HE-1(I + HE-1)-1. Now by Property 5 of Eigenvalues and Eigenvectors, if λ is an eigenvalue of HE-1 then 1 + λ is an eigenvalue of I + HE-1 and by Property 4 of Eigenvalues and Eigenvectors, is an eigenvalue of (I + HE-1)-1. Thus
And so we see that is an eigenvalue of (HE-1)(I + HE-1))-1 = H(H + E)-1. Thus by Property 1b of Eigenvalues and Eigenvectors, V = trace(H(H+E)-1) =
More parallels with ANOVA
The Pillai-Barlett Trace is similar to SSB/SST, which is the percentage of the variance explained by the model, which is similar to R2. It is the most conservative of the tests but is most robust in cases of violation of the assumptions at least for balanced models.
Wilk’s Lambda is similar to SSE /SST = 1 – R2. It is the most commonly used of the tests.
The Hotelling-Lawley Trace is similar to SSB/SSE which is the F-test used in univariate ANOVA. This is the least conservative of the three tests.
Eigenvalues Example
Example 1 (continued): Calculate the eigenvalues of HE-1 and the values of the test statistics based on Property 3.
Figure 7 – Test statistics using eigenvalues for Example 1
Here the eigenvalues of HE-1 (range X15:Z15) are calculated by the Real Statistics array formula eVALUES(X11:Z13). The Wilks test statistic is then calculated by the array formula =1/PRODUCT(1+X15:Z15), Hotelling’s Trace by the ordinary formula =SUM(X15:Z15), Pillai’s Trace by the array formula =SUM(X15:Z15/(1+X15:Z15)) and Roy by =X15. Note that the results obtained in Figure 6 are the same as those in Figure 7.
Wilk’s Lambda Test
Property 4 (Wilk’s Lambda Test)
Let
If the null hypothesis is true, then
Hotelling-Lawley Trace Test
Property 5 (Hotelling-Lawley Trace Test)
Let
s = min(k, m – 1) = # of non-zero eigenvalues in HE-1
If the null hypothesis is true, then
![]()
 Note that df1 = s ∙ max(k, m – 1)
Pillai-Barlett Trace Test
Property 6 (Pillai-Barlett Trace Test)
Under the same assumption as Property 5
Comparing the tests
For large samples, the above three measures are quite similar. For small samples, Pillai-Barlett Trace Test is the preferred method since it is less vulnerable to violations of the assumptions.
Hypthesis Testing Example
Example 1 (continued): Calculate the various test statistics and determine whether to reject the null hypothesis.
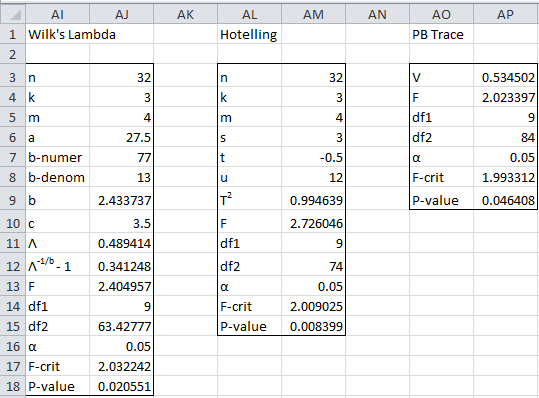
Using the values calculated previously for each test statistic and applying Properties 4, 5 and 6, we obtain the results shown in Figure 8.
Figure 8 – Test results for Example 1
Since p-value < α = .05 for all the tests, we conclude that there is a significant difference between the four groups.
Examples Workbook
Click here to download the Excel workbook with the examples described on this webpage.
References
Johnson, R. A., Wichern, D. W. (2007) Applied multivariate statistical analysis. 6th Ed. Pearson
https://mathematics.foi.hr/Applied%20Multivariate%20Statistical%20Analysis%20by%20Johnson%20and%20Wichern.pdf
Rencher, A.C., Christensen, W. F. (2012) Methods of multivariate analysis (3nd Ed). Wiley
IBM (2017) MANOVA algorithms. IBM SPSS Statistics Algorithms
https://public.dhe.ibm.com/software/analytics/spss/documentation/statistics/24.0/en/client/Manuals/IBM_SPSS_Statistics_Algorithms.pdf









Please could you indicate what the formula is for calculating the sample in a two-hay manova, or indicate a reference to be able to search on this topic.
Hi Marco,
What do you mean by “calculating the sample”?
Charles
Hello,
I think I’m not understanding something important (I’m quite new with multivariate work). I went through your other page with generating & plotting ellipses around data. I have three data sets, and they ended up that the three ellipses are each in the same general shape/direction (due to similar covariance matrices), though some are longer. All three ellipses also contain all three averages of the data sets. This seems like they would *not* be significantly different? At least it seemed that way based on how univariate confidence intervals worked. Then for practice I did the three tests listed on this page (Wilk’s lambda, Hotelling-Lawley trace, and Pillai-Barlett trace tests). Wilk’s had p=0.004, Hotelling-Lawley had p=0.999, and Pillai-Barlett had p=0.005. Would it make sense for these to be so different? And would it make sense that the two would have significant results given that the means are all within all of the ellipses? I’m getting a sense that there is something conceptually I’m missing or I’ve messed up my spreadsheet, just in some way I don’t understand since I was able to reproduce the corn results in your example.
Thank you for your time.
Hello Matt,
It seems very unlikely that “Wilk’s had p=0.004, Hotelling-Lawley had p=0.999, and Pillai-Barlett had p=0.005”. If you email me an Excel file with your data and test results, I will try to see what is going wrong.
Charles
Hello Charles,
Thank you for the reply. I agree about that being unlikely and found that when calculating T2 I had multiplied the eigenvalues instead of adding them. It just happened that in one of the spreadsheets I started with, these values were very close so it didn’t cause a problem. When I fixed the math error, the Hotelling-Lawley test had p=0.002.
However, I’m still a little bit confused about how if each of the drawn ellipses contain each of the means why then the tests each agree that they are significantly different. It feels still like there’s something important I’m not understanding about how these work.
Unfortunately I can’t give the data, which I understand makes it difficult to help.
Hi Matt,
You can change the data in any way you are comfortable with, as long as the p-values for two versions of the test are so different.
Charles
Hello
Can i do MANOVA test if independent variable is ordinal data?
my research is the impact of social support on depresion and anxiety
social suport =independent variable
depresion and anxiety = dependent
thank you
Technically, no. But it is common to treat ordinal data as continuous data. If the ordinal data is on a Likert scale then the more scale members the better: 1-9 is better than 1-7, which is better than 1-5. The presumption is the “distance” between say 4 and 5 is the same as between say 2 and 3.
Charles
Hello Sir,
I obtained Wilk’s Λ value , however I am confused on how to calculate the p-value in Excel (shown in fig.8), that will allow me to accept or reject my null hypothesis. Could you please explain how you did it? I’ve tried using the function =MANOVA_WilksTest() but it gives a value error. Also, how did you calculate critical value α that you used to compare with the p-value?
Athena,
You can download the spreadsheet I used to make the calculations from the Multivariate Analysis examples workbook. You can find the link to this file at https://www.real-statistics.com/free-download/real-statistics-examples-workbook/
Charles
Hello sir
I have 3 sample mean Vectors and population variance covariance matrix
Now i want to test sample means are equal
Then statistic is wills lambda and how to find w
These issues are explained on this webpage and the webpages linked to it.
What is your specific question?
Charles
Dear Charles; I want to answer the following research questions using the following data and sampled households using one way MANOVA. Please, I need your comments on appropriateness of the model; and if the model is appropriate how to specify the model for analysis? (1)Do small scale farmers’ households’ in lowland and highland differ in terms of overall adoption of adaptation strategies? Do small scale farmers’ households’ in lowland and highland differ in terms of overall adoption of coping strategies? Are lowland better than highland in terms of their adaptation/coping strategies? (2) I have categorical dependent variable (highland and lowland farmers) having sample size of 139 and 196 respectively. (3) 18 independent variables (11 for adaptation and 7 for coping) scaled as “usual, sometimes, rarely, not at all. The frequency of usual scale was used for indication of the extent of their adoptions ”Can I use both adaptation and coping at the same time or run separately? Can I compare the two techniques within and against the group?
Hi, i have like 4 dependent variables and one independent variable. What would be the best statistical to use that applies to my study? Thank you, i really need a help. 🙂
btw, all of the variables have 10 entries all in all
Hello Angel,
It depends on what hypotheses you want to test, but with multiple dependent variables, MANOVA is often a reasonable test.
Charles
Hi in the example used above shouldn’t the correlation coefficient between each pair of response variable be roughly close to (+/-)0.6???
Some are not even correlated negating the assumptions of MANOVA
Aurindom,
I don’t know what .6 refers to. Is this related to the homogeneity of covariance matrices assumption?
Charles
When I have 2 dependent variables, will I use MANOVA or ANOVA? Thanks
Lance,
It depends on the details, but probably MANOVA
Charles
Thanks for the writeup, WHAT IS THE FORMULA FOR HYPOTHESIS DEGREE FREEDOM IF I HAVE DATA WITH MALE AND FEMALE as independent variable against two dependent variable.?
Sandra,
Since you will use an F test, there are two df values. These values are calculated as shown in Properties 4, 5 and 6 on this webpage where k = 2 and m = 2.
Charles
thanks. your explanation is very useful. But please is it the only way of testing hypothesis of MANOVA STATISTICAL TEST using excel or there is manual way?
You can do it manually as well. This is actually described on the Real Statistics website.
Charles
DR good afternoon, because the example of MANOVA does not apply ANOVA II ?, I understand that here you are seeing each group as a vector, that would be the difference?
Thank you
DR buenas tardes, porque en ejemplo de MANOVA no se aplica un ANOVA II?, entiendo que aca estas viendo cada grupo como un vector, esa sería la diferencia?
Gracias
Gerardo,
Yes, that is correct.
Charles
Hi
I want to ask
where you got that data about a new type corn seeds?
you make by yourself?or you find that in web?
Thanks
Dwi,
All the data on the website are made up by me. None of it is real.
Charles
Hell thanks for your helpI have data with male and female of animals
With 4 independent variable can I use MANOVA CRD
The significant between the sex
Mahmood,
If you have 4 dependent variables, then you could use MANOVA. In fact with only two independent variables (male and female), you can use Hotelling’s T-square Test.
Charles
hello thank you for your help
please do you have new MANOVA ONE WAY data I NEED IT PLEASE SEND TO ME
There is no new MANOVA one-way data.
Charles
hello
thanks for your help
is there EXAMPLE unbalaced manova CRD
No
hi
i am looking into investigating causalities in rail project costs. costs would be disagreggated into subcategories reflecting different subworks. would manova be appropriate?
Sorry, but you haven’t provided enough information for me to respond.
Charles
Thanks prof for this useful insight. Please i’m researching on effects of cement stabilization on geotechnical properties of expansive soils with the % of cement added which is an interval continuous variable (IV) , and the various properties ( liquid limit, plastic limit, plastic index, linear shrinkage, max dry density, optimum moisture content and california bearing ration, CBR) as the response variables. Would MANOVA be appropriate?, and if yes..would it be a repeated measures or otherwise? Pls put me through on this.
Thank you.
John,
Based on the limited information that you have provided it seems like MANOVA could be a good choice. I don’t see any repeated measure factor in your list, but perhaps there is one.
Charles
Do you have instructions for expanding the MANOVA to a two-way or three-way?
Jack,
Sorry, but not yet. I expect to do this later this year.
Charles
In the example, you conclude there is a significant difference between the four groups. The next step would be to determinewhich groups. How does one do ad-hoc comparisons under manova?
Jack,
See Manova webpage. It contains links to some follow up tests.
Charles
Hello Charles,
I have installed the data analysis add-in module that you have provided on this website.
On Manova function,
I keep getting an error on the Input range field.
Whatever data range I put in the range becomes absolute range with that dollar sign. Thereby the result is also errored. I tried manually correct it by deleting the $ signs, but it then doesn’t work. I have Win 10 and MS Office 365.
Is this with my computer? or something else?
Any help is greatly appreciated.
Since this is the input range, I can-t see why there is a problem using absolute addressing. What is the problem_
Charles
Good day sir!
Is MANOVA a suitable test for RCBD experiments? I was planning on testing some 14 factors, all of which are agronomic data (e.g. plant height, biomass, grain yield) and I’m trying to figure out on how to add the blocks as an additional factor. Thanks in advance!
See the following webpage
https://www.researchgate.net/post/Can_MANOVA_be_performed_on_data_with_RCBD
Charles
Hi Sir,
First of all, it’s really amazing that you’ve put all this up for free and I really appreciate it. I noticed that you mention a “COV” and “COVP” function in this page and the workbook containing this example seems to reference it, but there isn’t actually a COV or COVP function in excel or, it seems, previous versions. Could I clarify if these are related to the COVARIANCE.P function in excel or if they are custom functions?
Many thanks,
Chris
Chris,
These are custom functions that are included in the Real Statistics software. You can download the software for free.
Charles
Hello Sir, we need your help. Could you please show us how the steps to calculate E ? Actually we already found H. But then stuck to get E. Hope get respond from you Sir. Thanks.
Hello Anis,
To calculate E you need to use Definition 4 on the referenced webpage. It is not so different from the calculation for H and T. If you are having problems, you can download the Multivariate Examples file which contains all the multivariate calculations shown on the website. This is available for free download at Examples Workbooks.
Charles
How do you determine the degrees of freedom when reporting the results of an MANOVA?
I have a data set with 2 independent variables and 2 dependent variables. One of the independent variables has 2 levels and the other one 3 levels). In total, I have 62 subjects.
Jose,
This is esplained on the MANOVA webpages.
Charles
Halo Prof.. Please help me here i want to analyse the effects of sustainable building materials on housing construction. My dependant variable are cost of construction, Running costs and Waste reduction. How can i go about it?
Hello Livison,
It sounds like this could be done via MANOVA or regression, but you haven’t provided enough information for me to give a definitive answer.
Charles
Mr. Charles,
Good Day sir!
May I ask your help regarding our research. If MANOVA is applicable to our study. Our IV is Smoking cigar and two DV are Labor productivity of workers and productivity of the firm.
Thank you sir.
This has the form of MANOVA. Are the assumptions met?
Charles
How come in figure 2 your mean for G6 (loam, yield) is 69.7125 when it’s supposed to be 69.7088? Yeah, I copied your data and that’s the mean I got. Am I missing something?
I just recalculated the mean and still came up with the value of 69.7125. If you send me an Excel file with your calculation, I will check it out.
Charles
eeehhhh gilllll mas entendible tenias que hacerlo ooohhhhh
Hello Charles,
Could you help me please to choose the correct method to analyze the following data:
I carried out an experiment in which 15 subjects had to assess 3 audio reproduction systems evaluating 7 characteristics (variables). So they did a comparative listening task of the 3 systems evaluating the 7 characteristics with continuous scales. One of the variables (the variable seven) is supposed to depend on the other six. I want to know the influence of the audio system over the variables and the relationship of the variable seven to the other six in regards to the three systems.
Thanks,
Juan
Juan,
If by “variable seven is supposed to depend on the other six [variables]” you mean that there is a correlation between variable 7 and the others, then MANOVA seems to be the way in order to go to determine whether the 3 audio reproduction systems have the same characteristics.
Can you please describe in more detail what you mean by “I want to know … the relationship of the variable seven to the other six in regards to the three systems”?
Charles
Thank you for your answer.
The variable seven is related to the preference of the subject in relation to the type of system. So, I want to know how this preference is associated with the other six variables.
When you say that MANOVA seems to be the way… Do I use MANOVA with repeated measures ? Can I do that with real statistic tool ? I saw that there is an option of repeated measures in MANOVA but I’m not sure if it applies for my case.
Thanks again for your help.
Juan
Juan,
Sorry, but I don’t completely understand the problem. When you speak about “the relationship of the variable seven to the other six variables” it sounds like a regression problem.
Part of what you described sounds like a repeated measures MANOVA, which is supported in the Real Statistics Resource Pack.
Charles
Thanks Charles,
Actually I want to know firstly if there is a difference between systems concerning the variable 7 (preference) and then I want to know how the other 6 variables are related to this “preference”.
Thanks again,
Juan Pablo
Juan,
To determine whether variable 7 is different from each of the other 6 variables can be done via MANOVA or 6 separate Hotelling’s T-square tests.
To determine how the 6 other variables are related to the 7th can be done via regression.
Charles
Hello Sir,
Please help me figure it out how to use this program for the following problem:
I study Corrosion Science, and as a field of interest, Microbial Corrosion. In my study, I focused on three factors affecting corrosion of metals: Salinity,Velocity and presence of specific micro-organism in the medium. As it seems, growth of micro-organism is also dependent of salinity and velocity, so in order to calculate the synergistic effect of these three factors on corrosion, i need to design a proper form of MANOVA matrix, which includes the effect of two independent variables “salinity and velocity”on the dependent variable”growth of bacteria”, and at the same time, calculate the effect of these three variables on corrosion rate.
In the study I used two levels for each variable : low level and high level…. so I assume, the size of samples would be n=2 ?
Thank you for your help.
Mary,
Clearly your sample size should be a lot more than 2. Perhaps you mean k = 2.
Charles
yes k=2, but the first problem stands…
Mary,
I didn’t see a statement of another problem. Based on the info that you provided, it looks like you can use MANOVA as described in Example 1 of the referenced webpage. The data will have two columns since you have only two dependent variables. Since you only have two dependent variables, you can also use Hotelling’s T-square Test. There are Real Statistics data analysis tools for both tests.
Charles
Hi. I would like to ask a question.
What is the equation/formula that I can use under MANOVA to find differences between dependent variables and three (3) independent variables?
I cant seem to find the answer, yet.
There are multiple ways for me to interpret your question. Can you give me a concrete example of what you are looking for based on Example 1 of the referenced webpage?
Charles
If the MANOVA analysis shows that the null hypothesis can be rejected, how do we know exactly WHICH groups are different (For example, maybe clay, loam, and sandy are similar, but salty is very different from the others)? Would we perform pairwise Hotelling’s on each of our groups?
Follow up tests are described on the following two webpages:
Follow up using ANOVA
Follow up using Contrasts
Charles
Thanks a lot sir, it was so helpful 🙂
hi. I just wanna ask if i can use MANOVA if i have 5 experimantal groups and is observed in 5 different hours.
Omar,
MANOVA can be used in such cases. See the webpage https://real-statistics.com/multivariate-statistics/multivariate-repeated-measures-tests/ for details. Of course, Repeated Measures ANOVA is also an option.
Charles
ohhhhhhhhh
thanks thanks
i need answer for this question: in MANOVA analysis if hotelling test and Wilk’s Lambda test and Pillai-Bartlett Trace are not significant and there is one significant for any dependent variable what i can do??????
Waleed,
It sounds like the MANOVA test supports the null hypothesis. No problem with that; you just need to report the result. I don’t completely understand what you mean by “there is one significant for any dependent variable”.
Charles
Hi, Thanks for making this available. Do you have a repeated measures MANOVA? ~R
Hi RGC,
Repeated measures MANOVA is not yet supported, but I expect to add it later this year.
Charles
Sir
I just want to make sure in the example “loam, sandy, salty, clay” are categories and “yield of the crop, amount of water required, amount of herbicide ” are dependent variables, is that right?
Colin
Colin,
“loam, sandy, salty, clay” are the categories of the dependent variable and “yield of the crop, amount of water required, amount of herbicide ” are independent variables.
Charles
Sir,
I suspect my question is a bit tiresome, but I honestly tried to understand why “loam, salty, sandy and clay” should be dependent. By definition, “MANOVA … investigates the effects of a categorical variable (i.e. clay, loam etc. in our case) on a continuous outcome … represented by a vector of dependent variables (i.e. water, herbicide, yield in our case)”. My logic is that the type of soil, being INdependent, determinates the yield, the amound of water and herbicide needed, and not the other way round. Please help me get this right. Thank you.
Roman,
You are correct: “loam, salty, sandy and clay” are the values of the independent variable “soil type”. The dependent vector consists of “water, herbicide, yield”.
Please let me know if you saw the opposite on the referenced webpage.
Charles
You say it yourself:
Colin,
“loam, sandy, salty, clay” are the categories of the dependent variable and “yield of the crop, amount of water required, amount of herbicide ” are independent variables.
Charles”