Univariate case
In paired sample hypothesis testing, a sample from the population is chosen and two measurements for each element in the sample are taken. Each set of measurements is considered a sample, but the samples are not independent of one another. Paired samples are also called matched samples or repeated measures. Examples include:
- Comparing the driving skills of people before and after they take a driver’s training course
- Determining whether the attitudes of husbands and wives differ regarding capital punishment
- Determining the effectiveness of a mosquito repellent by applying the repellent to the right arm of each subject in the sample (but not the left arm) and determining whether the right arm has fewer bites than the left arm.
Here we have two samples for the random variables x and y and test the null hypothesis that the population mean of x and y are equal. This is equivalent to the one-sample t-test on the random variable z = x – y. Specifically, we test the null hypothesis H0: μz = 0, which is equivalent to H0: μx = μy.
Multivariate case
The multivariate case is very similar to the univariate case. Now we have two samples for the random vectors X and Y and test the null hypothesis that the population mean vectors of X and Y are equal. This is equivalent to the One Sample Hotelling’s T2 Test on the random vector Z = X – Y. Specifically, we test the null hypothesis H0: μZ = 0, which is equivalent to H0: μX = μY. We illustrate the approach used in the following example.
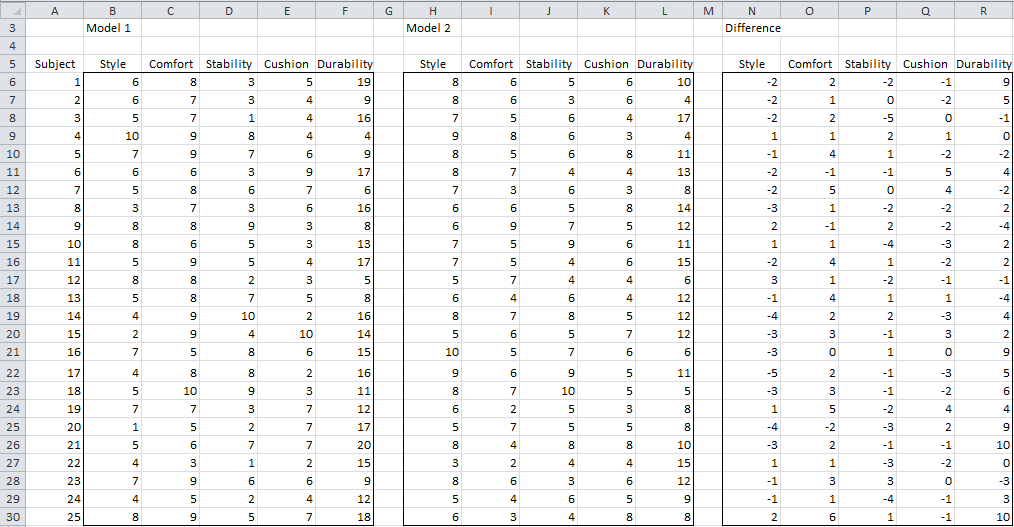
Example 1: The shoe company from Example 1 of One Sample Hotelling’s T2 Test is considering phasing out an existing shoe model (Model 2) with the prototype described in Example 1 of One Sample Hotelling’s T2 Test. The company had the same subjects evaluate both Model 1 and Model 2 and looked to see if there was a significant difference between the two models which would help them decide whether to replace Model 2 with Model 1. The sample is shown in Figure 1.
Figure 1 – Data for paired samples Hotelling’s T2 model
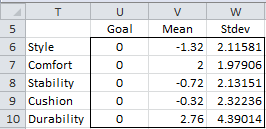
Essentially we perform the same analysis as in One Sample Hotelling’s T2 Test, with the goal being 0 for the difference between the two evaluations for each criterion. We repeat the analysis in the next few figures.
Figure 2 – Goal for difference between the two models
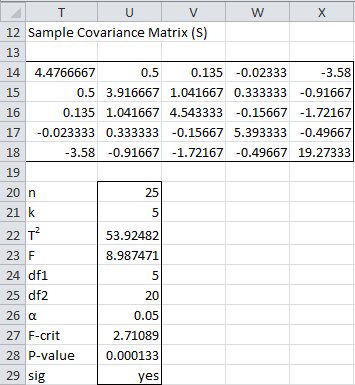
Figure 3 – Output shows a significant difference between models
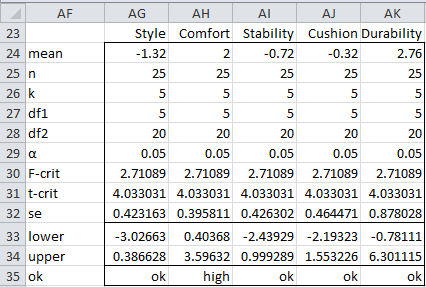
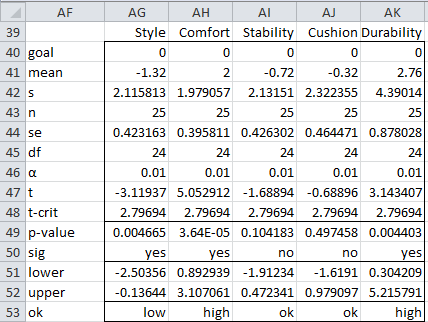
From Figure 3, we see there is a significant difference between the two shoe models. We next determine for which criteria there is a significant difference, using both 95% simultaneous confidence intervals and 95% Bonferroni confidence intervals.
Figure 4 – 95% simultaneous confidence intervals
Figure 5 – 95% Bonferroni confidence intervals
Examples Workbook
Click here to download the Excel workbook with the examples described on this webpage.
References
Penn State University (2013) Hotelling’s T-square. STAT 505: Applied multivariate statistical analysis (course notes)
https://online.stat.psu.edu/stat505/lesson/7/7.1/7.1.3
Rencher, A.C. (2002) Methods of multivariate analysis (2nd Ed). Wiley-Interscience, New York.
http://math.bme.hu/~csicsman/oktatas/statprog/gyak/SAS/eng/Statistics%20eBook%20-%20Methods%20of%20Multivariate%20Analysis%20-%202nd%20Ed%20Wiley%202002%20-%20(By%20Laxxuss).pdf
Johnson, R. A. and Wichern, D. W. (2007) Applied multivariate statistical analysis. 6th Ed. Pearson.
https://mathematics.foi.hr/Applied%20Multivariate%20Statistical%20Analysis%20by%20Johnson%20and%20Wichern.pdf
Do you have any reference to compute the required sample size for Hotelling’ Paired (dependent) Sample T square? Please do leave a comment on this matter. Thank you.
Hello Eunice,
First of all, the paired test is simply a one-sample Hotelling’s T-square test using the sample of paired differences. The computation of the sample size required is des cribed at:
https://www.real-statistics.com/multivariate-statistics/hotellings-t-square-statistic/hotelling-t-square-power/
Charles
Dear Charles,
how can I compute the Mahalanobis distance for Hotelling-TSquare paired-sample test? Is this a good measure for the effect size of the test?
Thank you very much
Best Regards
Piero
Piero,
Yes, the Mahalanobis distance can be used as an effect size measurement. See
https://real-statistics.com/multivariate-statistics/hotellings-t-square-statistic/hotelling-t-square-power/
Charles
Charles,
is the Mahalanobis distance for paired samples given by:
D = sqrt(2/n*T2) ?
Thank you
Piero
Piero,
If D is the Mahalanobis distance squared, then T2 = nD for a one-sample test. The formula should be the same where n = the number of pairs and the distance is for the differences.
See also https://real-statistics.com/multivariate-statistics/multivariate-normal-distribution/multivariate-normal-distribution-basic-concepts/
Charles
The “paired samples” and “repeated measures” options produced different results. Can you clarify the difference? Thank you.
Hello Raymond,
These two tests are not testing the same things, and so the results can be different.
The paired samples Hotelling’s T-square test is an extension of the paired t-test to multiple dependent variables, while the repeated measures test uses a one-sample Hotelling’s T-square test to perform a repeated measures ANOVA
See https://real-statistics.com/multivariate-statistics/multivariate-repeated-measures-tests/one-factor-multivariate-repeated-measures/
Charles
Hai,
My case is, the household general waste is sorted to produce 3 fractions of waste (biodegradable, nonbiodegradable, and refused waste for disposal). I want to measure how significant is the three waste fractions sorted from the general waste. Just confuse that my reviewer suggested me to use multivariate analysis instead of a paired t-test. My understanding is multivariate analysis is to test correlation while t-test for comparing means. Thanks
The paired-sample Hotelling’s T-square test is the multivariate version of the paired t-test.
Charles
Is it appropriate to enter only the variables that are significant into the Hotelling test, i.e. first perform separate paired t-tests, then discard the ones that are not significant, and enter the remaining significant outcomes into the Hotelling test? For example, say there are 10 dependent variables, we first carry out ten t-tests — 5 came out significant (i.e., p<.05). Take these 5 dependent variables and enter them into the Hotelling test (discard the other 5 that were not significant). Then use the results of the Hotelling test to rank these 5 dependent variables — from most significant to least significant, i.e. rank the variables in order of their significance using the Hotelling test. There may be other more straightfoward methods, e.g. effect size, etc. I would appreciate your thoughts on using the Hotelling test to rank significant dependent variables.
Raymond,
I wouldn’t do that for the following reasons: (1) increase in experimentwise error and (2) this ignores the impact of the correlations among the dependent variables.
Charles
Yes, the five dependent variables in the Hotelling test (in my example) should not be significantly correlated. Let’s assume they are not … and I also understand the part about the inflated alpha, let’s “ignore” this for the time being, if you don’t mind.
Raymond,
If the dependent variables are not significantly correlated there is nothing to be gained by using Hotelling’s test. You can simply conduct paired t tests.
Charles
Dear Charles
Does the number of subjects in each group has to be the same for a Paired Sample Hotelling’s T-square test or can this test still be performed when there are different numbers of participants?
Thanks
Sarah,
The sample consists of pairs, and so the number of subjects in each has to be the same.
Charles
im adam from ghana msc applied stats i known have better undestanding of hos test tanks sir
On-Market Day Off-Market Day
food items market A market B market A market B
x1 y1 x2 y2 x1 y1 x2 y2
1
2
3
.
.
.
26
pls what statistical tool will be more appropriate?
x1 means price during Xmas, X2 means Price after Xmas, y1 and y2 means distcance of food item from source.
thank you
On-Market Day Off-Market Day
food items market A market B market A market B
x1 y1 x2 y2 x1 y1 x2 y2
Gabby,
Sorry, but I don’t understand your example well enough to reply.
Charles
sir please is it possible to use t squared to test the relationship between mortality rates and incidence rate? or maybe fertility rate and mortality rates? thank you
Jimmy,
If you are just comparing mortality rates and incidence rates, then a simple paired t test may be sufficient. If there are multiple dependent variables then the paired t-squared test could be appropriate (if the assumptions for the test are met).
You need to provide additional information before I can give a more definitive answer.
Charles
Hi Sir,
Can I ask for the steps done after the hotellings t square? The post hoc doesn’t give a very detailed explanation. Thanks in advance!
Dave,
Since for the Hotelling’s T-square tests there are only two independent variables (Model 1 and Model 2), if there is a significant difference, a post-hoc analysis looks at which dependent variables are making a significant contribution to the difference (if any). The referenced webpage only lightly touches on this, but the One sample Hotelling’s T-square test webpage goes into a lot more detail (the section called Confidence Intervals). But since the Paired Samples test is simply a One Sample test on the differences, the analysis is the same.
Sir,
Is it possible to to use the two sample Kolmogorov-Smirnov test to compare the joint distribution of two variables obtained in matrix form?
TJ,
There are multivariate forms of the two sample Kolmogorov-Smirnov test, but I have not used them. I found the following paper which may be useful to you: http://www.uam.es/personal_pdi/ciencias/ajustel/papers/1997-spl.pdf
Charles
Sir,
Is there any limit for the t2 value. In my case, it is going up to 400.
TJ,
I don’t know of any limits on the values of t2. I have run a model where t2 is more than 12,000.
Charles
Sir,
Do you have any literature on the paired sample Hotelling’s T-square test.I really appreciate any help you can provide.
TJ,
You can take a look at the references in the website Bibliography. I believe reference PS2 could be especially helpful.
Charles
Hi,
I am trying to compare two matrices of same size and find out if they are similar or not by using a statistical test.Can I use this test for comparison or are there any better tests?
Hi TJ,
You can use the Paired Sample T-square test to compare matrices, but many other tests may also be suitable or better. It all depends upon what sort of data is contained in the matrices and what you are trying to test.
Charle
Sir,
I have percentage distribution of two variables in matrix form. Now, I have to compare two matrices through some test and check if there is any significant difference between the two matrices.
TJ,
If you are checking whether there is a significant difference between the two distributions you can use the two sample Kolmogorov-Smirnov test. If the data are normally distributed you could use the two sample t test to determine whether the means are significantly different. There are other tests, but this is a start. You can click on the highlighted links to get more information.
Charles