Worksheet Functions
Real Statistics Functions: The Real Statistics Resource Pack provides the T2TEST worksheet function to handle the various Hotelling T2 tests.
T2TEST(R1, R2, type) = the p-value for Hotelling’s T2 test where type takes the value 0, 1, 2, or 3.
A type of 0 represents the one-sample case, where R1 is the sample and R2 is a column vector representing the population mean column vector being tested (e.g. for Example 1 of One Sample Hotelling’s T-square, R1 is B4:F28 and R2 is I4:I8).
Types 1, 2, and 3 represent two-sample tests, where R1 and R2 are the samples. As for the T.TEST, the types have the following meanings:
- paired values from one sample
- two samples from populations with the same covariance matrices
- two samples from populations with different covariance matrices
The Real Statistics Resource Pack also provides the following functions, where R1, R2, and type are as described above.
HotellingT2 (R1, R2, type) = T2 statistic
HotellingF (R1, R2, type) = F statistic
Hotellingdf (R1, R2, type) = df2 parameter (the df1 parameter is always equal to the number of columns in R1)
Finally, the following array function combines all of the above functions:
Hotelling(R1, R2, type, lab): outputs a column array with the values T-square, df1, df2, F, and p-value for Hotelling’s T2 test for the data in R1 and R2.
Here type is as described above. If lab = TRUE a column of labels is added to the output, while if lab = FALSE (default) no labels are added.
Data Analysis Tool
Real Statistics Data Analysis Tool: The Real Statistics Resource Pack provides Hotelling’s T-square data analysis tool.
For Example 1 of Hotelling’s T-square Test with Unequal Covariance Matrices, enter Ctrl-m and double-click on the Multivariate Analyses option. From the dialog box that appears select the Hotelling’s T-square option and click on the OK button. Now fill in the fields in the dialog box that appears as shown in Figure 1.
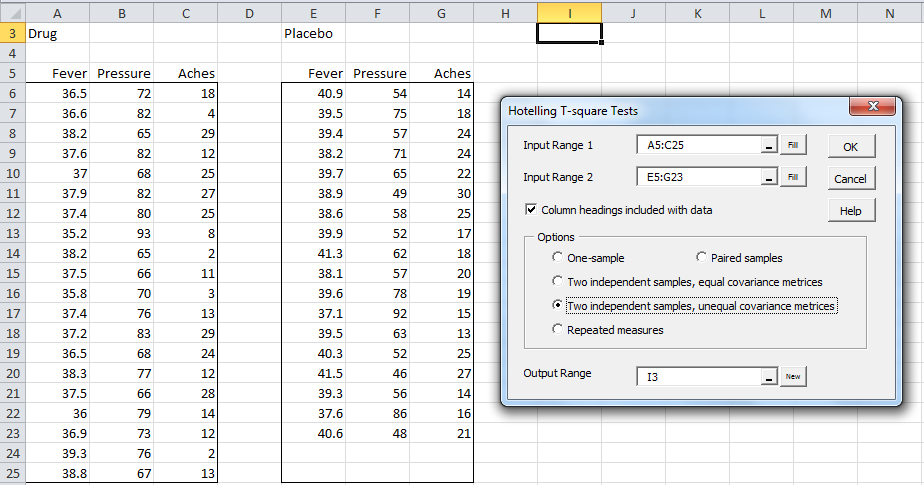
Figure 1 – Hotelling’s T-square dialog box
Note that the input cannot contain any non-numeric data. Thus Input Range 2 must be E5:G23 and not E5:G25.
The output is shown in Figure 2.
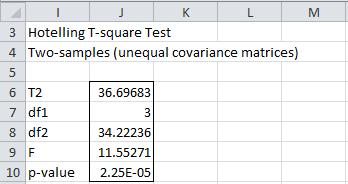
Figure 2 – Hotelling’s T-square data analysis tool
Examples Workbook
Click here to download the Excel workbook with the examples described on this webpage.
References
Penn State University (2013) Hotelling’s T-square. STAT 505: Applied multivariate statistical analysis (course notes)
https://online.stat.psu.edu/stat505/lesson/7/7.1/7.1.3
Rencher, A.C. (2002) Methods of multivariate analysis (2nd Ed). Wiley-Interscience, New York.
http://math.bme.hu/~csicsman/oktatas/statprog/gyak/SAS/eng/Statistics%20eBook%20-%20Methods%20of%20Multivariate%20Analysis%20-%202nd%20Ed%20Wiley%202002%20-%20(By%20Laxxuss).pdf
Johnson, R. A., Wichern, D. W. (2007) Applied multivariate statistical analysis. 6th Ed. Pearson
https://mathematics.foi.hr/Applied%20Multivariate%20Statistical%20Analysis%20by%20Johnson%20and%20Wichern.pdf
Hi Charles,
Am I correct that the Hotelling’s T2 test requires more observations than variables? Do you have a version that can overcome this restriction?
Thanks,
David
Hi David,
Suppose that you have 3 dependent variables and want to perform a two-independent sample T-square test. df1 = 3 no matter how many observations you have. I am counting as an observation a 3-tuple for each sample. With 5 observations df2 = 6, with 4 observations df2 = 4, and with 3 observations df2 = 2. Therefore, no problem if the number of observations is at least as big as the number of dependent variables. With 2 observations df2 = 0 which is impossible and so you get an error. You won’t be able to use this test in this case.
Charles
welcome
Gentlemen, I look for Hotelling’s t.test matrix
Whoever can help me send it to me, thanks in advance
To my following mailing address: ahmedgheraissa@gmail.com
Hello Ahmed,
I am not sure what table you are referring to. Is this a table that appears on the webpage?
You can download for free all the spreadsheets used on the Real Statistics website from
https://www.real-statistics.com/free-download/real-statistics-examples-workbook/
Charles
Hello Charles,
does the Hotelling T-Square Real Statistics tool handles missing data?
I mean, I am doing a paired sample Hotelling T-Square, but for one of the dependent variables some pairs of values are missing, like in the following:
Before After
A B C A B C
3 5 8 4 4 7
2 9 2 8
8 4 1 5 6 2
So you can see that for C variable a pair of values is missing.
I ran the test in Excel on data like above, I don’t get any error and the output seems to be reasonable, but I don’t know if I can trust 100% on these results.
Thank you very much
Best Regards
Piero
Sorry there is a formatting problem, test data are:
Before After
A B C A B C
3 5 8 4 4 7
2 9 X 2 8 X
8 4 1 5 6 2
where the X stands for “missing data”
Piero
Piero,
The current implementation does not support missing data (except for listwise elimination of the whole row).
Various techniques for dealing with missing data are explored at
Handling Missing Data
Charles
Hello Charles,
so this means that I should remove the second row in my example data, otherwise also the simultaneous confidence intervals that I will compute – following Hotelling T2 statistics – for variates A and B are affected?
Thank you very much
Piero
Piero,
If you have many other rows of data then removing one row shouldn’t distort the results very much. Alternatively, you can use an imputation technique.
Charles
Hello Charles,
as missing values are only for one variate, I found that the EM algorithm gives excellent results in providing an estimate for missing data.
Thank you very much for your help!!
Regards
Piero
Great!
Charles
Olá! Preciso de muita ajuda!!! Estou na parte estatística do meu tcc e preciso fazer esse teste t2 de hotlling só que não tenho nenhuma experiência com análises estatísticas e já estou com um prazo bem curto para enviar meu trabalho pronto. Alguém poderia me ajudar???
Do you have any specific questions that would help you do the work?
Charles
Hi, I’ve figured out the issue. The formula is working, but because the data is limited (low N’s), the calculated denominators approach 0, leading Excel to return an error value. With larger/different values, the functions are working perfectly.
Thank you.
I am not able to find the ‘Hotelling T-square tests’ in the installed Add-ins Real Statistics tools window in Excels 2007.
Can you help me out?
After pressing Ctrl-m or clicking on the tool in the Add-Ins ribbon, double click on the Multivariate Analyses option. The Hotelling T-square tests will be one of the choices on the next dialog box that appears.
Charles
Hello!
I followed the steps of Hotelling T-square test, but it always produced the following results.
Hotelling T-square Test
One-sample test
#VALUE! #VALUE!
#VALUE! #VALUE!
#VALUE! #VALUE!
#VALUE! #VALUE!
#VALUE! #VALUE!
If you send me an Excel spreadsheet with your data and results, I’ll try to find out what has gone wrong.
Charles
Hi, I have a similar problem. I have tried to change the input parameters for R1 and R2 of these functions and it still gives me a #VALUE! error output. I have checked that the data is numerical, I have tried it on a different set of data, I have re-started Excel, and I have tried to use Excel’s evaluate formula tool, but the output is still all errors. My solver is on, the ver() function outputs correctly, and other functions in the Real Statistics package is working.
Thank you for your help.